

from a vessel at lower pressure to one of higher pressure, thus completing the
circulating catalyst loop.
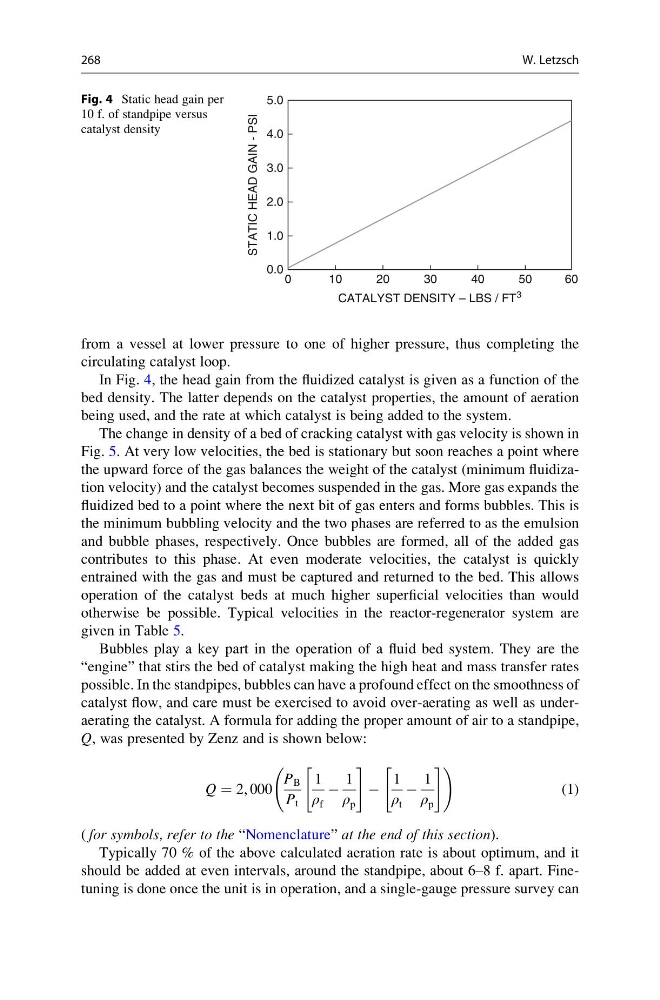
In Fig. 4, the head gain from the fluidized catalyst is given as a function of the
bed density. The latter depends on the catalyst properties, the amount of aeration
being used, and the rate at which catalyst is being added to the system.
The change in density of a bed of cracking catalyst with gas velocity is shown in
Fig. 5. At very low velocities, the bed is stationary but soon reaches a point where
the upward force of the gas balances the weight of the catalyst (minimum fluidization velocity) and the catalyst becomes suspended in the gas. More gas expands the
fluidized bed to a point where the next bit of gas enters and forms bubbles. This is
the minimum bubbling velocity and the two phases are referred to as the emulsion
and bubble phases, respectively. Once bubbles are formed, all of the added gas
contributes to this phase. At even moderate velocities, the catalyst is quickly
entrained with the gas and must be captured and returned to the bed. This allows
operation of the catalyst beds at much higher superficial velocities than would
otherwise be possible. Typical velocities in the reactor-regenerator system are
given in Table 5.
Bubbles play a key part in the operation of a fluid bed system. They are the
“engine” that stirs the bed of catalyst making the high heat and mass transfer rates
possible. In the standpipes, bubbles can have a profound effect on the smoothness of
catalyst flow, and care must be exercised to avoid over-aerating as well as underaerating the catalyst. A formula for adding the proper amount of air to a standpipe,
Q, was presented by Zenz and is shown below:
Q ¼ 2, 000
P B
P t
1
ρ f
À
1
ρ p
"
#
À
1
ρ t
À
1
ρ p
"
# !
(1)
( for symbols, refer to the “Nomenclature” at the end of this section).
Typically 70 % of the above calculated aeration rate is about optimum, and it
should be added at even intervals, around the standpipe, about 6–8 f. apart. Finetuning is done once the unit is in operation, and a single-gauge pressure survey can
0
0.0
1.0
2.0
3.0
4.0
5.0
10
20
30
40
CATALYST DENSITY – LBS / FT
3
STATIC HEAD GAIN - PSI
50
60
Fig. 4 Static head gain per
10 f. of standpipe versus
catalyst density
268
W. Letzsch
circulating catalyst loop.
In Fig. 4, the head gain from the fluidized catalyst is given as a function of the
bed density. The latter depends on the catalyst properties, the amount of aeration
being used, and the rate at which catalyst is being added to the system.
The change in density of a bed of cracking catalyst with gas velocity is shown in
Fig. 5. At very low velocities, the bed is stationary but soon reaches a point where
the upward force of the gas balances the weight of the catalyst (minimum fluidization velocity) and the catalyst becomes suspended in the gas. More gas expands the
fluidized bed to a point where the next bit of gas enters and forms bubbles. This is
the minimum bubbling velocity and the two phases are referred to as the emulsion
and bubble phases, respectively. Once bubbles are formed, all of the added gas
contributes to this phase. At even moderate velocities, the catalyst is quickly
entrained with the gas and must be captured and returned to the bed. This allows
operation of the catalyst beds at much higher superficial velocities than would
otherwise be possible. Typical velocities in the reactor-regenerator system are
given in Table 5.
Bubbles play a key part in the operation of a fluid bed system. They are the
“engine” that stirs the bed of catalyst making the high heat and mass transfer rates
possible. In the standpipes, bubbles can have a profound effect on the smoothness of
catalyst flow, and care must be exercised to avoid over-aerating as well as underaerating the catalyst. A formula for adding the proper amount of air to a standpipe,
Q, was presented by Zenz and is shown below:
Q ¼ 2, 000
P B
P t
1
ρ f
À
1
ρ p
"
#
À
1
ρ t
À
1
ρ p
"
# !
(1)
( for symbols, refer to the “Nomenclature” at the end of this section).
Typically 70 % of the above calculated aeration rate is about optimum, and it
should be added at even intervals, around the standpipe, about 6–8 f. apart. Finetuning is done once the unit is in operation, and a single-gauge pressure survey can
0
0.0
1.0
2.0
3.0
4.0
5.0
10
20
30
40
CATALYST DENSITY – LBS / FT
3
STATIC HEAD GAIN - PSI
50
60
Fig. 4 Static head gain per
10 f. of standpipe versus
catalyst density
268
W. Letzsch