

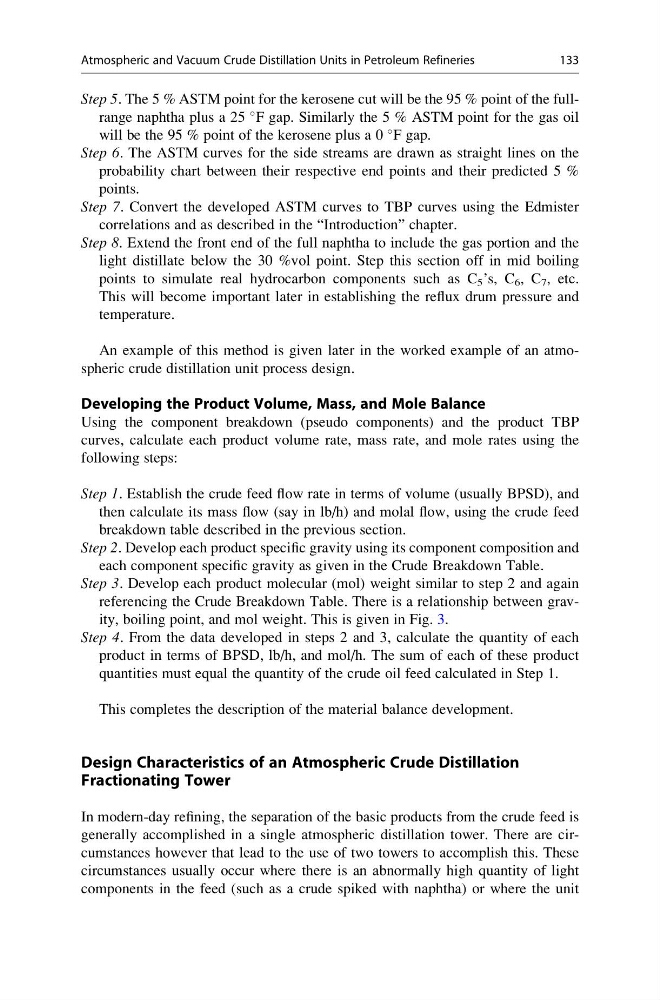
Step 5. The 5 % ASTM point for the kerosene cut will be the 95 % point of the fullrange naphtha plus a 25
F gap. Similarly the 5 % ASTM point for the gas oil
will be the 95 % point of the kerosene plus a 0
F gap.
Step 6. The ASTM curves for the side streams are drawn as straight lines on the
probability chart between their respective end points and their predicted 5 %
points.
Step 7. Convert the developed ASTM curves to TBP curves using the Edmister
correlations and as described in the “Introduction” chapter.
Step 8. Extend the front end of the full naphtha to include the gas portion and the
light distillate below the 30 %vol point. Step this section off in mid boiling
points to simulate real hydrocarbon components such as C 5 ’s, C 6 , C 7 , etc.
This will become important later in establishing the reflux drum pressure and
temperature.
An example of this method is given later in the worked example of an atmospheric crude distillation unit process design.
Developing the Product Volume, Mass, and Mole Balance
Using the component breakdown (pseudo components) and the product TBP
curves, calculate each product volume rate, mass rate, and mole rates using the
following steps:
Step 1. Establish the crude feed flow rate in terms of volume (usually BPSD), and
then calculate its mass flow (say in lb/h) and molal flow, using the crude feed
breakdown table described in the previous section.
Step 2. Develop each product specific gravity using its component composition and
each component specific gravity as given in the Crude Breakdown Table.
Step 3. Develop each product molecular (mol) weight similar to step 2 and again
referencing the Crude Breakdown Table. There is a relationship between gravity, boiling point, and mol weight. This is given in Fig. 3.
Step 4. From the data developed in steps 2 and 3, calculate the quantity of each
product in terms of BPSD, lb/h, and mol/h. The sum of each of these product
quantities must equal the quantity of the crude oil feed calculated in Step 1.
This completes the description of the material balance development.
Design Characteristics of an Atmospheric Crude Distillation
Fractionating Tower
In modern-day refining, the separation of the basic products from the crude feed is
generally accomplished in a single atmospheric distillation tower. There are circumstances however that lead to the use of two towers to accomplish this. These
circumstances usually occur where there is an abnormally high quantity of light
components in the feed (such as a crude spiked with naphtha) or where the unit
Atmospheric and Vacuum Crude Distillation Units in Petroleum Refineries
133
F gap. Similarly the 5 % ASTM point for the gas oil
will be the 95 % point of the kerosene plus a 0
F gap.
Step 6. The ASTM curves for the side streams are drawn as straight lines on the
probability chart between their respective end points and their predicted 5 %
points.
Step 7. Convert the developed ASTM curves to TBP curves using the Edmister
correlations and as described in the “Introduction” chapter.
Step 8. Extend the front end of the full naphtha to include the gas portion and the
light distillate below the 30 %vol point. Step this section off in mid boiling
points to simulate real hydrocarbon components such as C 5 ’s, C 6 , C 7 , etc.
This will become important later in establishing the reflux drum pressure and
temperature.
An example of this method is given later in the worked example of an atmospheric crude distillation unit process design.
Developing the Product Volume, Mass, and Mole Balance
Using the component breakdown (pseudo components) and the product TBP
curves, calculate each product volume rate, mass rate, and mole rates using the
following steps:
Step 1. Establish the crude feed flow rate in terms of volume (usually BPSD), and
then calculate its mass flow (say in lb/h) and molal flow, using the crude feed
breakdown table described in the previous section.
Step 2. Develop each product specific gravity using its component composition and
each component specific gravity as given in the Crude Breakdown Table.
Step 3. Develop each product molecular (mol) weight similar to step 2 and again
referencing the Crude Breakdown Table. There is a relationship between gravity, boiling point, and mol weight. This is given in Fig. 3.
Step 4. From the data developed in steps 2 and 3, calculate the quantity of each
product in terms of BPSD, lb/h, and mol/h. The sum of each of these product
quantities must equal the quantity of the crude oil feed calculated in Step 1.
This completes the description of the material balance development.
Design Characteristics of an Atmospheric Crude Distillation
Fractionating Tower
In modern-day refining, the separation of the basic products from the crude feed is
generally accomplished in a single atmospheric distillation tower. There are circumstances however that lead to the use of two towers to accomplish this. These
circumstances usually occur where there is an abnormally high quantity of light
components in the feed (such as a crude spiked with naphtha) or where the unit
Atmospheric and Vacuum Crude Distillation Units in Petroleum Refineries
133