

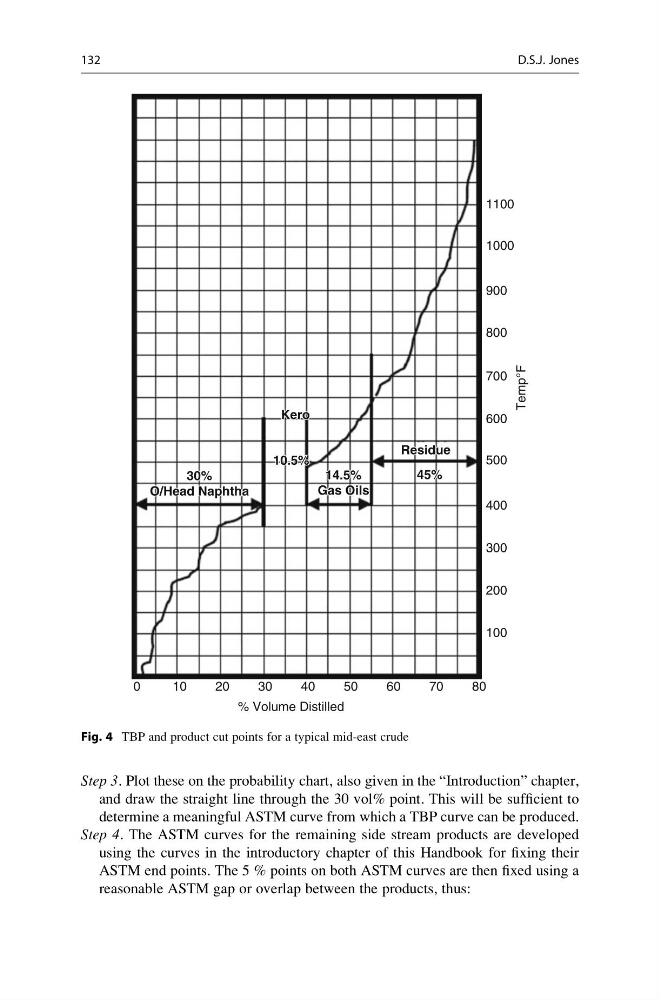
Step 3. Plot these on the probability chart, also given in the “Introduction” chapter,
and draw the straight line through the 30 vol% point. This will be sufficient to
determine a meaningful ASTM curve from which a TBP curve can be produced.
Step 4. The ASTM curves for the remaining side stream products are developed
using the curves in the introductory chapter of this Handbook for fixing their
ASTM end points. The 5 % points on both ASTM curves are then fixed using a
reasonable ASTM gap or overlap between the products, thus:
1100
1000
900
800
700
600
500
30% 30%
O/Head Naphtha
O/Head Naphtha
14.5% 14.5%
Gas Oils
Gas Oils
10.5% 10.5%
Kero Kero
45% 45%
Residue Residue
400
300
200
100
0
10
20
30
% Volume Distilled
40
50
60
70
80
Temp°F
30%
O/Head Naphtha
14.5%
Gas Oils
10.5%
Kero
45%
Residue
Fig. 4 TBP and product cut points for a typical mid-east crude
132
D.S.J. Jones
and draw the straight line through the 30 vol% point. This will be sufficient to
determine a meaningful ASTM curve from which a TBP curve can be produced.
Step 4. The ASTM curves for the remaining side stream products are developed
using the curves in the introductory chapter of this Handbook for fixing their
ASTM end points. The 5 % points on both ASTM curves are then fixed using a
reasonable ASTM gap or overlap between the products, thus:
1100
1000
900
800
700
600
500
30% 30%
O/Head Naphtha
O/Head Naphtha
14.5% 14.5%
Gas Oils
Gas Oils
10.5% 10.5%
Kero Kero
45% 45%
Residue Residue
400
300
200
100
0
10
20
30
% Volume Distilled
40
50
60
70
80
Temp°F
30%
O/Head Naphtha
14.5%
Gas Oils
10.5%
Kero
45%
Residue
Fig. 4 TBP and product cut points for a typical mid-east crude
132
D.S.J. Jones