

3.1.3 Comparison of RT-TDDFT Results for Different ExchangeCorrelation Functionals, Pseudopotentials, and Basis Set
Descriptions
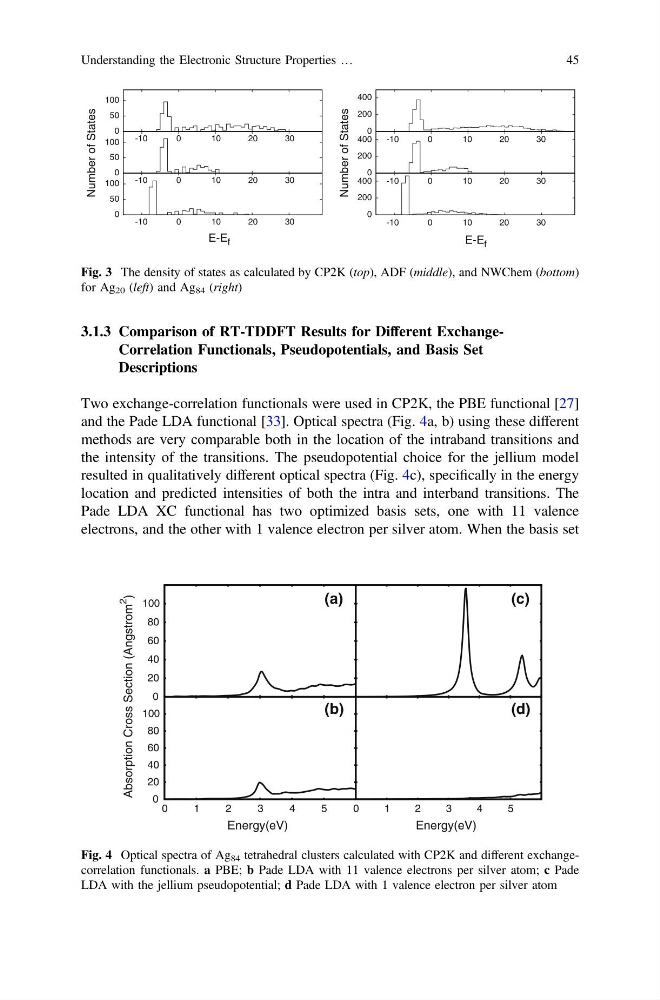
Two exchange-correlation functionals were used in CP2K, the PBE functional [27]
and the Pade LDA functional [33]. Optical spectra (Fig. 4a, b) using these different
methods are very comparable both in the location of the intraband transitions and
the intensity of the transitions. The pseudopotential choice for the jellium model
resulted in qualitatively different optical spectra (Fig. 4c), specifically in the energy
location and predicted intensities of both the intra and interband transitions. The
Pade LDA XC functional has two optimized basis sets, one with 11 valence
electrons, and the other with 1 valence electron per silver atom. When the basis set
0
50
100
-10
0
10
20
30
0
50
100
-10
0
10
20
30
Number of States
0
50
100
-10
0
10
20
30
E-E f
0
200
400
-10
0
10
20
30
0
200
400
-10
0
10
20
30
Number of States
0
200
400
-10
0
10
20
30
E-E f
Fig. 3 The density of states as calculated by CP2K (top), ADF (middle), and NWChem (bottom)
for Ag 20 (left) and Ag 84 (right)
0
20
40
60
80
100
(a)
(c)
0
20
40
60
80
100
0
1
2
3
4
5
Absorption Cross Section (Angstrom
2
)
Energy(eV)
(b)
0
1
2
3
4
5
Energy(eV)
(d)
Fig. 4 Optical spectra of Ag 84 tetrahedral clusters calculated with CP2K and different exchangecorrelation functionals. a PBE; b Pade LDA with 11 valence electrons per silver atom; c Pade
LDA with the jellium pseudopotential; d Pade LDA with 1 valence electron per silver atom
Understanding the Electronic Structure Properties …
45
Descriptions
Two exchange-correlation functionals were used in CP2K, the PBE functional [27]
and the Pade LDA functional [33]. Optical spectra (Fig. 4a, b) using these different
methods are very comparable both in the location of the intraband transitions and
the intensity of the transitions. The pseudopotential choice for the jellium model
resulted in qualitatively different optical spectra (Fig. 4c), specifically in the energy
location and predicted intensities of both the intra and interband transitions. The
Pade LDA XC functional has two optimized basis sets, one with 11 valence
electrons, and the other with 1 valence electron per silver atom. When the basis set
0
50
100
-10
0
10
20
30
0
50
100
-10
0
10
20
30
Number of States
0
50
100
-10
0
10
20
30
E-E f
0
200
400
-10
0
10
20
30
0
200
400
-10
0
10
20
30
Number of States
0
200
400
-10
0
10
20
30
E-E f
Fig. 3 The density of states as calculated by CP2K (top), ADF (middle), and NWChem (bottom)
for Ag 20 (left) and Ag 84 (right)
0
20
40
60
80
100
(a)
(c)
0
20
40
60
80
100
0
1
2
3
4
5
Absorption Cross Section (Angstrom
2
)
Energy(eV)
(b)
0
1
2
3
4
5
Energy(eV)
(d)
Fig. 4 Optical spectra of Ag 84 tetrahedral clusters calculated with CP2K and different exchangecorrelation functionals. a PBE; b Pade LDA with 11 valence electrons per silver atom; c Pade
LDA with the jellium pseudopotential; d Pade LDA with 1 valence electron per silver atom
Understanding the Electronic Structure Properties …
45