

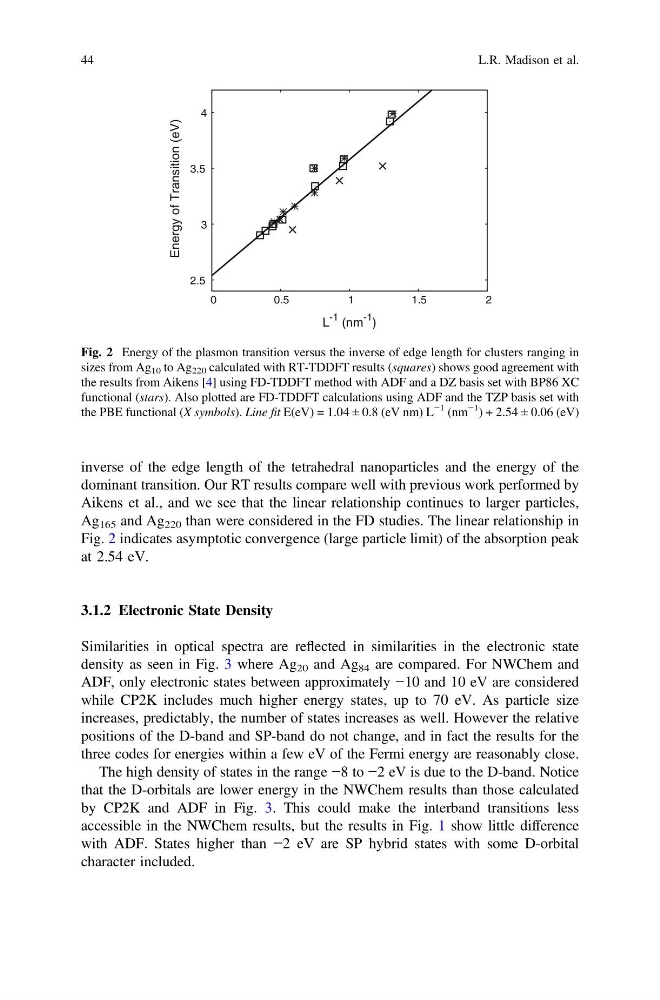
inverse of the edge length of the tetrahedral nanoparticles and the energy of the
dominant transition. Our RT results compare well with previous work performed by
Aikens et al., and we see that the linear relationship continues to larger particles,
Ag 165 and Ag 220 than were considered in the FD studies. The linear relationship in
Fig. 2 indicates asymptotic convergence (large particle limit) of the absorption peak
at 2.54 eV.
3.1.2 Electronic State Density
Similarities in optical spectra are reflected in similarities in the electronic state
density as seen in Fig. 3 where Ag 20 and Ag 84 are compared. For NWChem and
ADF, only electronic states between approximately −10 and 10 eV are considered
while CP2K includes much higher energy states, up to 70 eV. As particle size
increases, predictably, the number of states increases as well. However the relative
positions of the D-band and SP-band do not change, and in fact the results for the
three codes for energies within a few eV of the Fermi energy are reasonably close.
The high density of states in the range −8 to −2 eV is due to the D-band. Notice
that the D-orbitals are lower energy in the NWChem results than those calculated
by CP2K and ADF in Fig. 3. This could make the interband transitions less
accessible in the NWChem results, but the results in Fig. 1 show little difference
with ADF. States higher than −2 eV are SP hybrid states with some D-orbital
character included.
2.5
3
3.5
4
0
0.5
1
1.5
2
Energy of Transition (eV)
L
-1 (nm
-1
)
Fig. 2 Energy of the plasmon transition versus the inverse of edge length for clusters ranging in
sizes from Ag 10 to Ag 220 calculated with RT-TDDFT results (squares) shows good agreement with
the results from Aikens [4] using FD-TDDFT method with ADF and a DZ basis set with BP86 XC
functional (stars). Also plotted are FD-TDDFT calculations using ADF and the TZP basis set with
the PBE functional (X symbols). Line fit E(eV) = 1.04 ± 0.8 (eV nm) L
−1 (nm
−1
) + 2.54 ± 0.06 (eV)
44
L.R. Madison et al.
dominant transition. Our RT results compare well with previous work performed by
Aikens et al., and we see that the linear relationship continues to larger particles,
Ag 165 and Ag 220 than were considered in the FD studies. The linear relationship in
Fig. 2 indicates asymptotic convergence (large particle limit) of the absorption peak
at 2.54 eV.
3.1.2 Electronic State Density
Similarities in optical spectra are reflected in similarities in the electronic state
density as seen in Fig. 3 where Ag 20 and Ag 84 are compared. For NWChem and
ADF, only electronic states between approximately −10 and 10 eV are considered
while CP2K includes much higher energy states, up to 70 eV. As particle size
increases, predictably, the number of states increases as well. However the relative
positions of the D-band and SP-band do not change, and in fact the results for the
three codes for energies within a few eV of the Fermi energy are reasonably close.
The high density of states in the range −8 to −2 eV is due to the D-band. Notice
that the D-orbitals are lower energy in the NWChem results than those calculated
by CP2K and ADF in Fig. 3. This could make the interband transitions less
accessible in the NWChem results, but the results in Fig. 1 show little difference
with ADF. States higher than −2 eV are SP hybrid states with some D-orbital
character included.
2.5
3
3.5
4
0
0.5
1
1.5
2
Energy of Transition (eV)
L
-1 (nm
-1
)
Fig. 2 Energy of the plasmon transition versus the inverse of edge length for clusters ranging in
sizes from Ag 10 to Ag 220 calculated with RT-TDDFT results (squares) shows good agreement with
the results from Aikens [4] using FD-TDDFT method with ADF and a DZ basis set with BP86 XC
functional (stars). Also plotted are FD-TDDFT calculations using ADF and the TZP basis set with
the PBE functional (X symbols). Line fit E(eV) = 1.04 ± 0.8 (eV nm) L
−1 (nm
−1
) + 2.54 ± 0.06 (eV)
44
L.R. Madison et al.