

3 Results and Discussion
3.1 Comparison of RT-TDDFT and FD-TDDFT
3.1.1 Optical Properties
We first consider the absorption spectrum of Ag 20 and Ag 84 with the level of theory
of ADF, NWChem and CP2K chosen to be as close to the same as possible. Thus
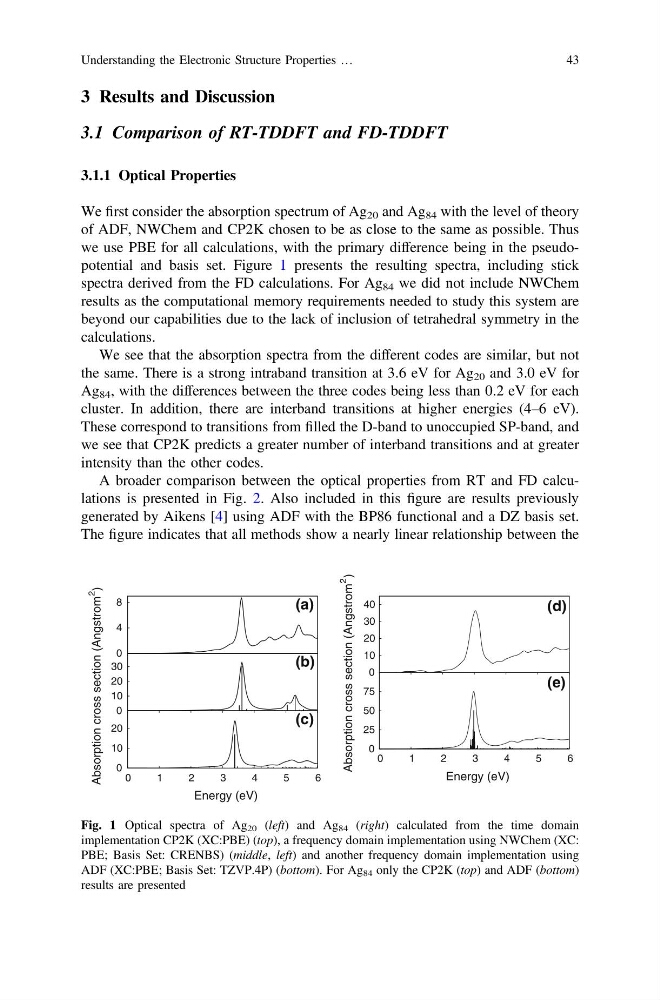
we use PBE for all calculations, with the primary difference being in the pseudopotential and basis set. Figure 1 presents the resulting spectra, including stick
spectra derived from the FD calculations. For Ag 84 we did not include NWChem
results as the computational memory requirements needed to study this system are
beyond our capabilities due to the lack of inclusion of tetrahedral symmetry in the
calculations.
We see that the absorption spectra from the different codes are similar, but not
the same. There is a strong intraband transition at 3.6 eV for Ag 20 and 3.0 eV for
Ag 84 , with the differences between the three codes being less than 0.2 eV for each
cluster. In addition, there are interband transitions at higher energies (4–6 eV).
These correspond to transitions from filled the D-band to unoccupied SP-band, and
we see that CP2K predicts a greater number of interband transitions and at greater
intensity than the other codes.
A broader comparison between the optical properties from RT and FD calculations is presented in Fig. 2. Also included in this figure are results previously
generated by Aikens [4] using ADF with the BP86 functional and a DZ basis set.
The figure indicates that all methods show a nearly linear relationship between the
0
4
8
(a)
0
10
20
30
Absorption cross section (Angstrom
2
)
(b)
0
10
20
0
1
2
3
4
5
6
Energy (eV)
(c)
0
10
20
30
40
(d)
0
25
50
75
0
1
2
3
4
5
6
Absorption cross section (Angstrom
2
)
Energy (eV)
(e)
Fig. 1 Optical spectra of Ag 20 (left) and Ag 84 (right) calculated from the time domain
implementation CP2K (XC:PBE) (top), a frequency domain implementation using NWChem (XC:
PBE; Basis Set: CRENBS) (middle, left) and another frequency domain implementation using
ADF (XC:PBE; Basis Set: TZVP.4P) (bottom). For Ag 84 only the CP2K (top) and ADF (bottom)
results are presented
Understanding the Electronic Structure Properties …
43
3.1 Comparison of RT-TDDFT and FD-TDDFT
3.1.1 Optical Properties
We first consider the absorption spectrum of Ag 20 and Ag 84 with the level of theory
of ADF, NWChem and CP2K chosen to be as close to the same as possible. Thus
we use PBE for all calculations, with the primary difference being in the pseudopotential and basis set. Figure 1 presents the resulting spectra, including stick
spectra derived from the FD calculations. For Ag 84 we did not include NWChem
results as the computational memory requirements needed to study this system are
beyond our capabilities due to the lack of inclusion of tetrahedral symmetry in the
calculations.
We see that the absorption spectra from the different codes are similar, but not
the same. There is a strong intraband transition at 3.6 eV for Ag 20 and 3.0 eV for
Ag 84 , with the differences between the three codes being less than 0.2 eV for each
cluster. In addition, there are interband transitions at higher energies (4–6 eV).
These correspond to transitions from filled the D-band to unoccupied SP-band, and
we see that CP2K predicts a greater number of interband transitions and at greater
intensity than the other codes.
A broader comparison between the optical properties from RT and FD calculations is presented in Fig. 2. Also included in this figure are results previously
generated by Aikens [4] using ADF with the BP86 functional and a DZ basis set.
The figure indicates that all methods show a nearly linear relationship between the
0
4
8
(a)
0
10
20
30
Absorption cross section (Angstrom
2
)
(b)
0
10
20
0
1
2
3
4
5
6
Energy (eV)
(c)
0
10
20
30
40
(d)
0
25
50
75
0
1
2
3
4
5
6
Absorption cross section (Angstrom
2
)
Energy (eV)
(e)
Fig. 1 Optical spectra of Ag 20 (left) and Ag 84 (right) calculated from the time domain
implementation CP2K (XC:PBE) (top), a frequency domain implementation using NWChem (XC:
PBE; Basis Set: CRENBS) (middle, left) and another frequency domain implementation using
ADF (XC:PBE; Basis Set: TZVP.4P) (bottom). For Ag 84 only the CP2K (top) and ADF (bottom)
results are presented
Understanding the Electronic Structure Properties …
43