

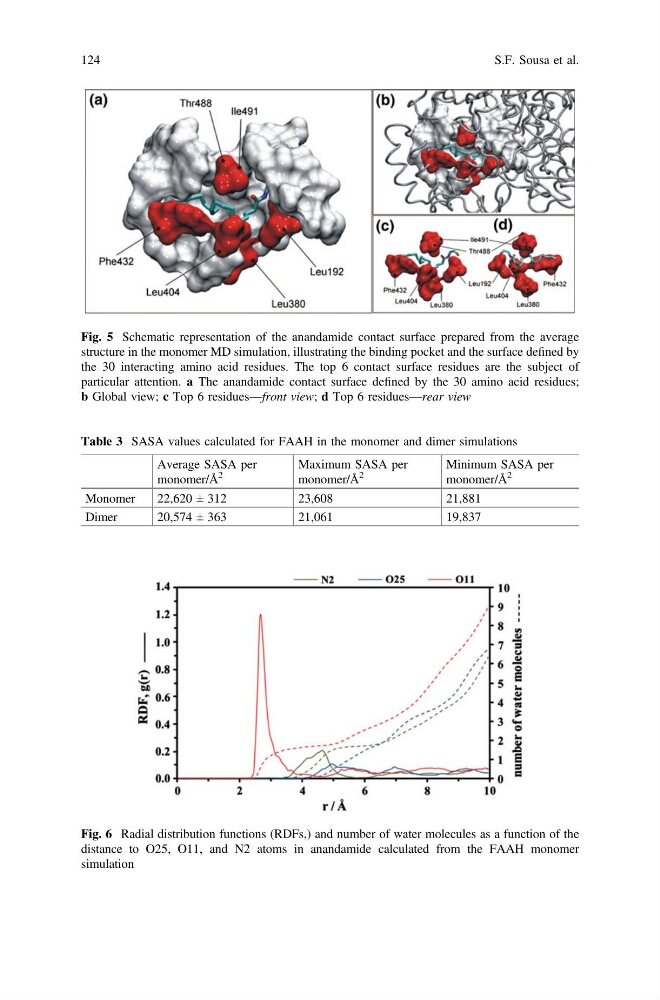
Fig. 5 Schematic representation of the anandamide contact surface prepared from the average
structure in the monomer MD simulation, illustrating the binding pocket and the surface defined by
the 30 interacting amino acid residues. The top 6 contact surface residues are the subject of
particular attention. a The anandamide contact surface defined by the 30 amino acid residues;
b Global view; c Top 6 residues—front view; d Top 6 residues—rear view
Table 3 SASA values calculated for FAAH in the monomer and dimer simulations
Average SASA per
monomer/Å
2
Maximum SASA per
monomer/Å
2
Minimum SASA per
monomer/Å
2
Monomer
22,620 ± 312
23,608
21,881
Dimer
20,574 ± 363
21,061
19,837
Fig. 6 Radial distribution functions (RDFs,) and number of water molecules as a function of the
distance to O25, O11, and N2 atoms in anandamide calculated from the FAAH monomer
simulation
124
S.F. Sousa et al.
structure in the monomer MD simulation, illustrating the binding pocket and the surface defined by
the 30 interacting amino acid residues. The top 6 contact surface residues are the subject of
particular attention. a The anandamide contact surface defined by the 30 amino acid residues;
b Global view; c Top 6 residues—front view; d Top 6 residues—rear view
Table 3 SASA values calculated for FAAH in the monomer and dimer simulations
Average SASA per
monomer/Å
2
Maximum SASA per
monomer/Å
2
Minimum SASA per
monomer/Å
2
Monomer
22,620 ± 312
23,608
21,881
Dimer
20,574 ± 363
21,061
19,837
Fig. 6 Radial distribution functions (RDFs,) and number of water molecules as a function of the
distance to O25, O11, and N2 atoms in anandamide calculated from the FAAH monomer
simulation
124
S.F. Sousa et al.