

particularly in the vicinity of the O11 atom and of the MD simulation, allows the
presence of 2 water molecules within a 6 Å radius of the O11 atom. These two
water molecules are retained around the O11 position during the full simulation,
with one of them establishing a strong hydrogen bond with the O11 atom of
Anandamide during most of the simulation.
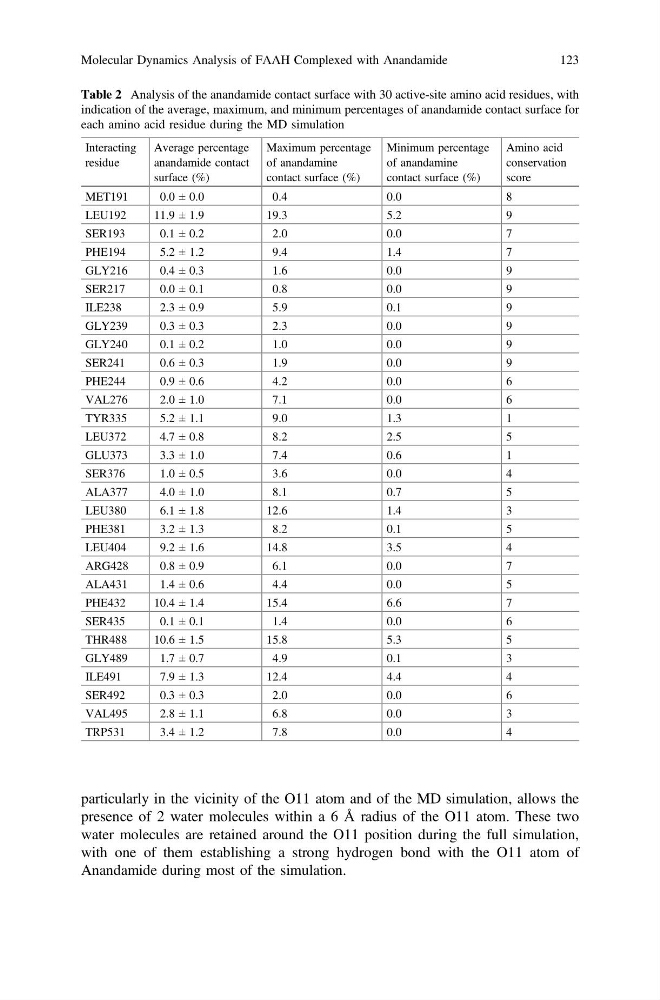
Table 2 Analysis of the anandamide contact surface with 30 active-site amino acid residues, with
indication of the average, maximum, and minimum percentages of anandamide contact surface for
each amino acid residue during the MD simulation
Interacting
residue
Average percentage
anandamide contact
surface (%)
Maximum percentage
of anandamine
contact surface (%)
Minimum percentage
of anandamine
contact surface (%)
Amino acid
conservation
score
MET191
0.0 ± 0.0
0.4
0.0
8
LEU192
11.9 ± 1.9
19.3
5.2
9
SER193
0.1 ± 0.2
2.0
0.0
7
PHE194
5.2 ± 1.2
9.4
1.4
7
GLY216
0.4 ± 0.3
1.6
0.0
9
SER217
0.0 ± 0.1
0.8
0.0
9
ILE238
2.3 ± 0.9
5.9
0.1
9
GLY239
0.3 ± 0.3
2.3
0.0
9
GLY240
0.1 ± 0.2
1.0
0.0
9
SER241
0.6 ± 0.3
1.9
0.0
9
PHE244
0.9 ± 0.6
4.2
0.0
6
VAL276
2.0 ± 1.0
7.1
0.0
6
TYR335
5.2 ± 1.1
9.0
1.3
1
LEU372
4.7 ± 0.8
8.2
2.5
5
GLU373
3.3 ± 1.0
7.4
0.6
1
SER376
1.0 ± 0.5
3.6
0.0
4
ALA377
4.0 ± 1.0
8.1
0.7
5
LEU380
6.1 ± 1.8
12.6
1.4
3
PHE381
3.2 ± 1.3
8.2
0.1
5
LEU404
9.2 ± 1.6
14.8
3.5
4
ARG428
0.8 ± 0.9
6.1
0.0
7
ALA431
1.4 ± 0.6
4.4
0.0
5
PHE432
10.4 ± 1.4
15.4
6.6
7
SER435
0.1 ± 0.1
1.4
0.0
6
THR488
10.6 ± 1.5
15.8
5.3
5
GLY489
1.7 ± 0.7
4.9
0.1
3
ILE491
7.9 ± 1.3
12.4
4.4
4
SER492
0.3 ± 0.3
2.0
0.0
6
VAL495
2.8 ± 1.1
6.8
0.0
3
TRP531
3.4 ± 1.2
7.8
0.0
4
Molecular Dynamics Analysis of FAAH Complexed with Anandamide
123
presence of 2 water molecules within a 6 Å radius of the O11 atom. These two
water molecules are retained around the O11 position during the full simulation,
with one of them establishing a strong hydrogen bond with the O11 atom of
Anandamide during most of the simulation.
Table 2 Analysis of the anandamide contact surface with 30 active-site amino acid residues, with
indication of the average, maximum, and minimum percentages of anandamide contact surface for
each amino acid residue during the MD simulation
Interacting
residue
Average percentage
anandamide contact
surface (%)
Maximum percentage
of anandamine
contact surface (%)
Minimum percentage
of anandamine
contact surface (%)
Amino acid
conservation
score
MET191
0.0 ± 0.0
0.4
0.0
8
LEU192
11.9 ± 1.9
19.3
5.2
9
SER193
0.1 ± 0.2
2.0
0.0
7
PHE194
5.2 ± 1.2
9.4
1.4
7
GLY216
0.4 ± 0.3
1.6
0.0
9
SER217
0.0 ± 0.1
0.8
0.0
9
ILE238
2.3 ± 0.9
5.9
0.1
9
GLY239
0.3 ± 0.3
2.3
0.0
9
GLY240
0.1 ± 0.2
1.0
0.0
9
SER241
0.6 ± 0.3
1.9
0.0
9
PHE244
0.9 ± 0.6
4.2
0.0
6
VAL276
2.0 ± 1.0
7.1
0.0
6
TYR335
5.2 ± 1.1
9.0
1.3
1
LEU372
4.7 ± 0.8
8.2
2.5
5
GLU373
3.3 ± 1.0
7.4
0.6
1
SER376
1.0 ± 0.5
3.6
0.0
4
ALA377
4.0 ± 1.0
8.1
0.7
5
LEU380
6.1 ± 1.8
12.6
1.4
3
PHE381
3.2 ± 1.3
8.2
0.1
5
LEU404
9.2 ± 1.6
14.8
3.5
4
ARG428
0.8 ± 0.9
6.1
0.0
7
ALA431
1.4 ± 0.6
4.4
0.0
5
PHE432
10.4 ± 1.4
15.4
6.6
7
SER435
0.1 ± 0.1
1.4
0.0
6
THR488
10.6 ± 1.5
15.8
5.3
5
GLY489
1.7 ± 0.7
4.9
0.1
3
ILE491
7.9 ± 1.3
12.4
4.4
4
SER492
0.3 ± 0.3
2.0
0.0
6
VAL495
2.8 ± 1.1
6.8
0.0
3
TRP531
3.4 ± 1.2
7.8
0.0
4
Molecular Dynamics Analysis of FAAH Complexed with Anandamide
123