

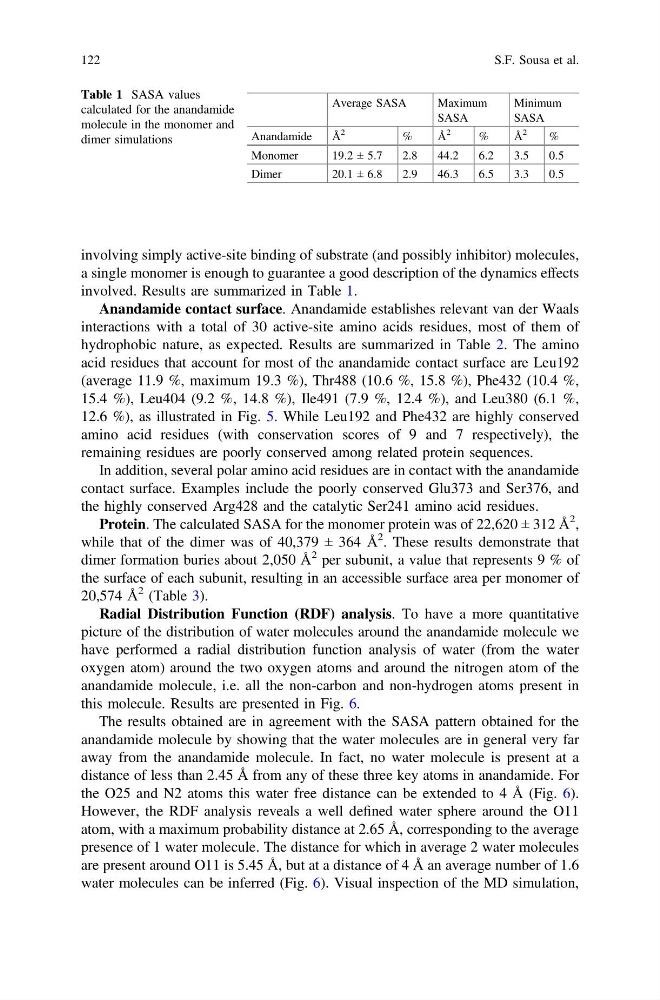
involving simply active-site binding of substrate (and possibly inhibitor) molecules,
a single monomer is enough to guarantee a good description of the dynamics effects
involved. Results are summarized in Table 1.
Anandamide contact surface. Anandamide establishes relevant van der Waals
interactions with a total of 30 active-site amino acids residues, most of them of
hydrophobic nature, as expected. Results are summarized in Table 2. The amino
acid residues that account for most of the anandamide contact surface are Leu192
(average 11.9 %, maximum 19.3 %), Thr488 (10.6 %, 15.8 %), Phe432 (10.4 %,
15.4 %), Leu404 (9.2 %, 14.8 %), Ile491 (7.9 %, 12.4 %), and Leu380 (6.1 %,
12.6 %), as illustrated in Fig. 5. While Leu192 and Phe432 are highly conserved
amino acid residues (with conservation scores of 9 and 7 respectively), the
remaining residues are poorly conserved among related protein sequences.
In addition, several polar amino acid residues are in contact with the anandamide
contact surface. Examples include the poorly conserved Glu373 and Ser376, and
the highly conserved Arg428 and the catalytic Ser241 amino acid residues.
Protein. The calculated SASA for the monomer protein was of 22,620 ± 312 Å
2 ,
while that of the dimer was of 40,379 ± 364 Å
2 . These results demonstrate that
dimer formation buries about 2,050 Å
2 per subunit, a value that represents 9 % of
the surface of each subunit, resulting in an accessible surface area per monomer of
20,574 Å
2 (Table 3).
Radial Distribution Function (RDF) analysis. To have a more quantitative
picture of the distribution of water molecules around the anandamide molecule we
have performed a radial distribution function analysis of water (from the water
oxygen atom) around the two oxygen atoms and around the nitrogen atom of the
anandamide molecule, i.e. all the non-carbon and non-hydrogen atoms present in
this molecule. Results are presented in Fig. 6.
The results obtained are in agreement with the SASA pattern obtained for the
anandamide molecule by showing that the water molecules are in general very far
away from the anandamide molecule. In fact, no water molecule is present at a
distance of less than 2.45 Å from any of these three key atoms in anandamide. For
the O25 and N2 atoms this water free distance can be extended to 4 Å (Fig. 6).
However, the RDF analysis reveals a well defined water sphere around the O11
atom, with a maximum probability distance at 2.65 Å, corresponding to the average
presence of 1 water molecule. The distance for which in average 2 water molecules
are present around O11 is 5.45 Å, but at a distance of 4 Å an average number of 1.6
water molecules can be inferred (Fig. 6). Visual inspection of the MD simulation,
Table 1 SASA values
calculated for the anandamide
molecule in the monomer and
dimer simulations
Average SASA
Maximum
SASA
Minimum
SASA
Anandamide
Å
2
%
Å
2
%
Å
2
%
Monomer
19.2 ± 5.7
2.8
44.2
6.2
3.5
0.5
Dimer
20.1 ± 6.8
2.9
46.3
6.5
3.3
0.5
122
S.F. Sousa et al.
a single monomer is enough to guarantee a good description of the dynamics effects
involved. Results are summarized in Table 1.
Anandamide contact surface. Anandamide establishes relevant van der Waals
interactions with a total of 30 active-site amino acids residues, most of them of
hydrophobic nature, as expected. Results are summarized in Table 2. The amino
acid residues that account for most of the anandamide contact surface are Leu192
(average 11.9 %, maximum 19.3 %), Thr488 (10.6 %, 15.8 %), Phe432 (10.4 %,
15.4 %), Leu404 (9.2 %, 14.8 %), Ile491 (7.9 %, 12.4 %), and Leu380 (6.1 %,
12.6 %), as illustrated in Fig. 5. While Leu192 and Phe432 are highly conserved
amino acid residues (with conservation scores of 9 and 7 respectively), the
remaining residues are poorly conserved among related protein sequences.
In addition, several polar amino acid residues are in contact with the anandamide
contact surface. Examples include the poorly conserved Glu373 and Ser376, and
the highly conserved Arg428 and the catalytic Ser241 amino acid residues.
Protein. The calculated SASA for the monomer protein was of 22,620 ± 312 Å
2 ,
while that of the dimer was of 40,379 ± 364 Å
2 . These results demonstrate that
dimer formation buries about 2,050 Å
2 per subunit, a value that represents 9 % of
the surface of each subunit, resulting in an accessible surface area per monomer of
20,574 Å
2 (Table 3).
Radial Distribution Function (RDF) analysis. To have a more quantitative
picture of the distribution of water molecules around the anandamide molecule we
have performed a radial distribution function analysis of water (from the water
oxygen atom) around the two oxygen atoms and around the nitrogen atom of the
anandamide molecule, i.e. all the non-carbon and non-hydrogen atoms present in
this molecule. Results are presented in Fig. 6.
The results obtained are in agreement with the SASA pattern obtained for the
anandamide molecule by showing that the water molecules are in general very far
away from the anandamide molecule. In fact, no water molecule is present at a
distance of less than 2.45 Å from any of these three key atoms in anandamide. For
the O25 and N2 atoms this water free distance can be extended to 4 Å (Fig. 6).
However, the RDF analysis reveals a well defined water sphere around the O11
atom, with a maximum probability distance at 2.65 Å, corresponding to the average
presence of 1 water molecule. The distance for which in average 2 water molecules
are present around O11 is 5.45 Å, but at a distance of 4 Å an average number of 1.6
water molecules can be inferred (Fig. 6). Visual inspection of the MD simulation,
Table 1 SASA values
calculated for the anandamide
molecule in the monomer and
dimer simulations
Average SASA
Maximum
SASA
Minimum
SASA
Anandamide
Å
2
%
Å
2
%
Å
2
%
Monomer
19.2 ± 5.7
2.8
44.2
6.2
3.5
0.5
Dimer
20.1 ± 6.8
2.9
46.3
6.5
3.3
0.5
122
S.F. Sousa et al.