

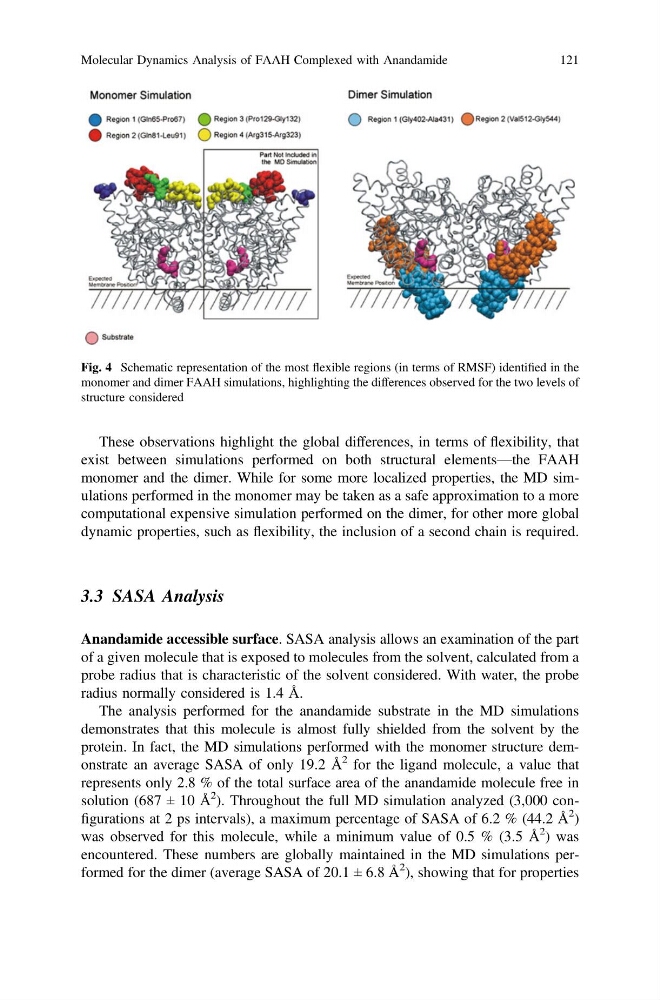
These observations highlight the global differences, in terms of flexibility, that
exist between simulations performed on both structural elements—the FAAH
monomer and the dimer. While for some more localized properties, the MD simulations performed in the monomer may be taken as a safe approximation to a more
computational expensive simulation performed on the dimer, for other more global
dynamic properties, such as flexibility, the inclusion of a second chain is required.
3.3 SASA Analysis
Anandamide accessible surface. SASA analysis allows an examination of the part
of a given molecule that is exposed to molecules from the solvent, calculated from a
probe radius that is characteristic of the solvent considered. With water, the probe
radius normally considered is 1.4 Å.
The analysis performed for the anandamide substrate in the MD simulations
demonstrates that this molecule is almost fully shielded from the solvent by the
protein. In fact, the MD simulations performed with the monomer structure demonstrate an average SASA of only 19.2 Å
2 for the ligand molecule, a value that
represents only 2.8 % of the total surface area of the anandamide molecule free in
solution (687 ± 10 Å
2 ). Throughout the full MD simulation analyzed (3,000 configurations at 2 ps intervals), a maximum percentage of SASA of 6.2 % (44.2 Å
2 )
was observed for this molecule, while a minimum value of 0.5 % (3.5 Å
2 ) was
encountered. These numbers are globally maintained in the MD simulations performed for the dimer (average SASA of 20.1 ± 6.8 Å
2 ), showing that for properties
Fig. 4 Schematic representation of the most flexible regions (in terms of RMSF) identified in the
monomer and dimer FAAH simulations, highlighting the differences observed for the two levels of
structure considered
Molecular Dynamics Analysis of FAAH Complexed with Anandamide
121
exist between simulations performed on both structural elements—the FAAH
monomer and the dimer. While for some more localized properties, the MD simulations performed in the monomer may be taken as a safe approximation to a more
computational expensive simulation performed on the dimer, for other more global
dynamic properties, such as flexibility, the inclusion of a second chain is required.
3.3 SASA Analysis
Anandamide accessible surface. SASA analysis allows an examination of the part
of a given molecule that is exposed to molecules from the solvent, calculated from a
probe radius that is characteristic of the solvent considered. With water, the probe
radius normally considered is 1.4 Å.
The analysis performed for the anandamide substrate in the MD simulations
demonstrates that this molecule is almost fully shielded from the solvent by the
protein. In fact, the MD simulations performed with the monomer structure demonstrate an average SASA of only 19.2 Å
2 for the ligand molecule, a value that
represents only 2.8 % of the total surface area of the anandamide molecule free in
solution (687 ± 10 Å
2 ). Throughout the full MD simulation analyzed (3,000 configurations at 2 ps intervals), a maximum percentage of SASA of 6.2 % (44.2 Å
2 )
was observed for this molecule, while a minimum value of 0.5 % (3.5 Å
2 ) was
encountered. These numbers are globally maintained in the MD simulations performed for the dimer (average SASA of 20.1 ± 6.8 Å
2 ), showing that for properties
Fig. 4 Schematic representation of the most flexible regions (in terms of RMSF) identified in the
monomer and dimer FAAH simulations, highlighting the differences observed for the two levels of
structure considered
Molecular Dynamics Analysis of FAAH Complexed with Anandamide
121