

pressure increases lead to a steady increase in density.
If CO 2 is stored underground at normal pressure
(hydrostatic; see Chap. 10), the geothermal gradient
determines the phase properties. Superimposed on the
density plot in Fig. 24.3 are three geothermal
gradients, one being quite average for the North Sea
(35
C/km) and the two others being Æ10
C/km. We
see that there are large differences in density, especially at shallow depth. It is also clear that CO 2 storage
reservoirs, which most likely will lie at depths greater
than 1 km, CO 2 will have densities between about 200
and 700 g/cm
3 compared to >1,000 g/cm
3 for brine,
giving a significant buoyancy, i.e. upward force.
To avoid corrosion of pipelines and formation of
hydrates (ice-like particles of water and CO 2 ), CO 2
should be injected as a dry phase with as little water as
possible in the stream. However, as soon as CO 2 is
injected into a reservoir, CO 2 mixes and dissolves in
water and some water dissolves back into the CO 2
phase and reacts to form carbonic acid. The mutual
solubilities of CO 2 and water depend on temperature
and pressure and on the salinity of the formation water.
Although the mutual solubilities are quite limited
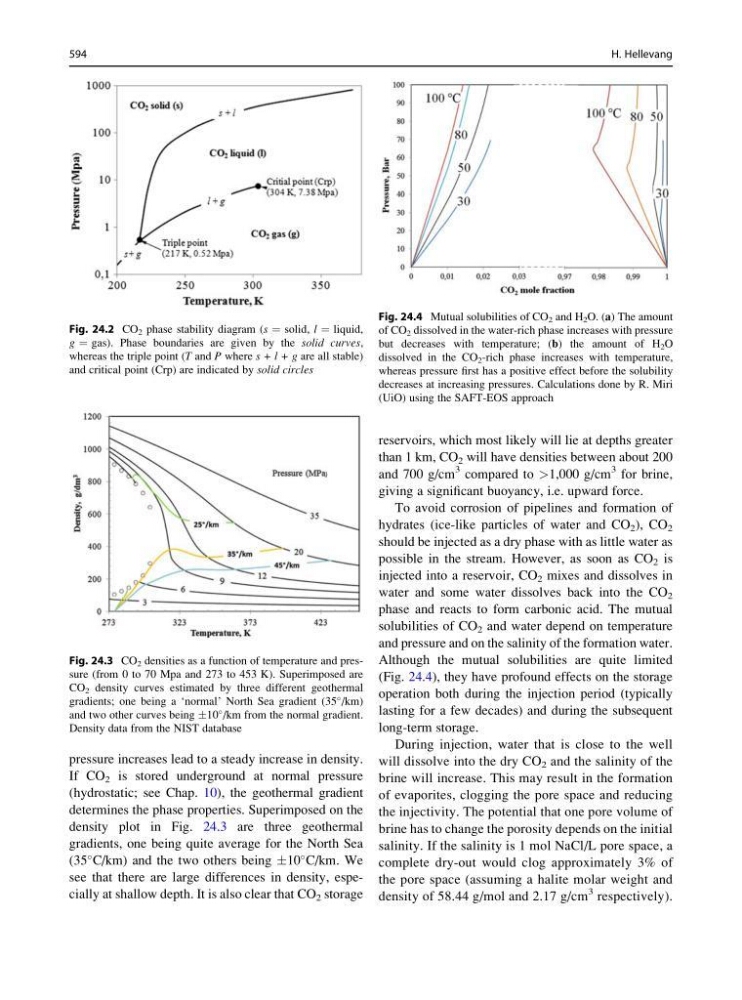
(Fig. 24.4), they have profound effects on the storage
operation both during the injection period (typically
lasting for a few decades) and during the subsequent
long-term storage.
During injection, water that is close to the well
will dissolve into the dry CO 2 and the salinity of the
brine will increase. This may result in the formation
of evaporites, clogging the pore space and reducing
the injectivity. The potential that one pore volume of
brine has to change the porosity depends on the initial
salinity. If the salinity is 1 mol NaCl/L pore space, a
complete dry-out would clog approximately 3% of
the pore space (assuming a halite molar weight and
density of 58.44 g/mol and 2.17 g/cm
3 respectively).
Fig. 24.3 CO 2 densities as a function of temperature and pressure (from 0 to 70 Mpa and 273 to 453 K). Superimposed are
CO 2 density curves estimated by three different geothermal
gradients; one being a ‘normal’ North Sea gradient (35
/km)
and two other curves being Æ10
/km from the normal gradient.
Density data from the NIST database
Fig. 24.2 CO 2 phase stability diagram (s ¼ solid, l ¼ liquid,
g ¼ gas). Phase boundaries are given by the solid curves,
whereas the triple point (T and P where s + l + g are all stable)
and critical point (Crp) are indicated by solid circles
Fig. 24.4 Mutual solubilities of CO 2 and H 2 O. (a) The amount
of CO 2 dissolved in the water-rich phase increases with pressure
but decreases with temperature; (b) the amount of H 2 O
dissolved in the CO 2 -rich phase increases with temperature,
whereas pressure first has a positive effect before the solubility
decreases at increasing pressures. Calculations done by R. Miri
(UiO) using the SAFT-EOS approach
594
H. Hellevang
If CO 2 is stored underground at normal pressure
(hydrostatic; see Chap. 10), the geothermal gradient
determines the phase properties. Superimposed on the
density plot in Fig. 24.3 are three geothermal
gradients, one being quite average for the North Sea
(35
C/km) and the two others being Æ10
C/km. We
see that there are large differences in density, especially at shallow depth. It is also clear that CO 2 storage
reservoirs, which most likely will lie at depths greater
than 1 km, CO 2 will have densities between about 200
and 700 g/cm
3 compared to >1,000 g/cm
3 for brine,
giving a significant buoyancy, i.e. upward force.
To avoid corrosion of pipelines and formation of
hydrates (ice-like particles of water and CO 2 ), CO 2
should be injected as a dry phase with as little water as
possible in the stream. However, as soon as CO 2 is
injected into a reservoir, CO 2 mixes and dissolves in
water and some water dissolves back into the CO 2
phase and reacts to form carbonic acid. The mutual
solubilities of CO 2 and water depend on temperature
and pressure and on the salinity of the formation water.
Although the mutual solubilities are quite limited
(Fig. 24.4), they have profound effects on the storage
operation both during the injection period (typically
lasting for a few decades) and during the subsequent
long-term storage.
During injection, water that is close to the well
will dissolve into the dry CO 2 and the salinity of the
brine will increase. This may result in the formation
of evaporites, clogging the pore space and reducing
the injectivity. The potential that one pore volume of
brine has to change the porosity depends on the initial
salinity. If the salinity is 1 mol NaCl/L pore space, a
complete dry-out would clog approximately 3% of
the pore space (assuming a halite molar weight and
density of 58.44 g/mol and 2.17 g/cm
3 respectively).
Fig. 24.3 CO 2 densities as a function of temperature and pressure (from 0 to 70 Mpa and 273 to 453 K). Superimposed are
CO 2 density curves estimated by three different geothermal
gradients; one being a ‘normal’ North Sea gradient (35
/km)
and two other curves being Æ10
/km from the normal gradient.
Density data from the NIST database
Fig. 24.2 CO 2 phase stability diagram (s ¼ solid, l ¼ liquid,
g ¼ gas). Phase boundaries are given by the solid curves,
whereas the triple point (T and P where s + l + g are all stable)
and critical point (Crp) are indicated by solid circles
Fig. 24.4 Mutual solubilities of CO 2 and H 2 O. (a) The amount
of CO 2 dissolved in the water-rich phase increases with pressure
but decreases with temperature; (b) the amount of H 2 O
dissolved in the CO 2 -rich phase increases with temperature,
whereas pressure first has a positive effect before the solubility
decreases at increasing pressures. Calculations done by R. Miri
(UiO) using the SAFT-EOS approach
594
H. Hellevang