

towards the east, is very well imaged. The transition
from resistive to conductive strata can be gradual. This
in combination with gradual thinning of the resistive
strata and general low resolution of the CSEM data
makes it difficult to define the lateral edge precisely.
The inverted MMT data has low resolution, but is able
to define deep and large-scale structures. It is not able
to define the shallower volcanic complex in any detail.
In the joint inversion result the total gross resistivity distribution is calculated. Two deep basin-shaped
conductive structures separated by a resistive structural high are present along the EM section
(Fig. 20.28). The low resistivity values below the
basaltic complex are comparable to the values above
the complex. This strongly indicates that sedimentary
strata are present below the basalts. The strata are
shaped as a low relief half graben bounded to the
east by a resistive ridge. Further, based on the shape
of the resistive bodies, the inferred basin could be
bounded by larger-scale faulting (stepwise deepening)
to the west, and more gradual shallowing towards the
east. East of the ridge the data show significant deepening into another sedimentary basin. This conductive
structure correlates with the position of the West
Shetland Basin.
This case study is a very good example of how
seismic-, CSEM- and MMT data can be combined to
reveal structures in an area were the individual data
set alone cannot resolve the problem.
20.8 Implications for HC Playand Prospect Evaluation
EM methods’ general ability to map electrical
properties in the subsurface has proven very good.
However, when using CSEM and MMT data for HC
exploration it should be kept in mind that they are low
resolution methods. Accurate depth estimation to
resistive anomalies can also be a challenge. In addition, for the CSEM method, depth penetration is
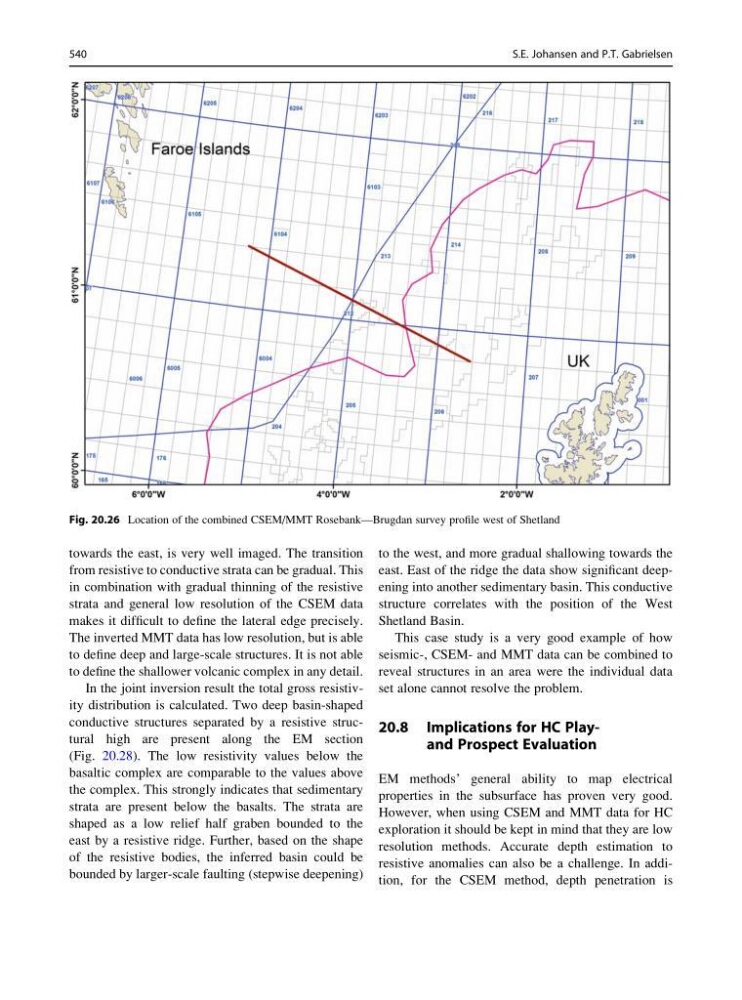
Fig. 20.26 Location of the combined CSEM/MMT Rosebank—Brugdan survey profile west of Shetland
540
S.E. Johansen and P.T. Gabrielsen
from resistive to conductive strata can be gradual. This
in combination with gradual thinning of the resistive
strata and general low resolution of the CSEM data
makes it difficult to define the lateral edge precisely.
The inverted MMT data has low resolution, but is able
to define deep and large-scale structures. It is not able
to define the shallower volcanic complex in any detail.
In the joint inversion result the total gross resistivity distribution is calculated. Two deep basin-shaped
conductive structures separated by a resistive structural high are present along the EM section
(Fig. 20.28). The low resistivity values below the
basaltic complex are comparable to the values above
the complex. This strongly indicates that sedimentary
strata are present below the basalts. The strata are
shaped as a low relief half graben bounded to the
east by a resistive ridge. Further, based on the shape
of the resistive bodies, the inferred basin could be
bounded by larger-scale faulting (stepwise deepening)
to the west, and more gradual shallowing towards the
east. East of the ridge the data show significant deepening into another sedimentary basin. This conductive
structure correlates with the position of the West
Shetland Basin.
This case study is a very good example of how
seismic-, CSEM- and MMT data can be combined to
reveal structures in an area were the individual data
set alone cannot resolve the problem.
20.8 Implications for HC Playand Prospect Evaluation
EM methods’ general ability to map electrical
properties in the subsurface has proven very good.
However, when using CSEM and MMT data for HC
exploration it should be kept in mind that they are low
resolution methods. Accurate depth estimation to
resistive anomalies can also be a challenge. In addition, for the CSEM method, depth penetration is
Fig. 20.26 Location of the combined CSEM/MMT Rosebank—Brugdan survey profile west of Shetland
540
S.E. Johansen and P.T. Gabrielsen