

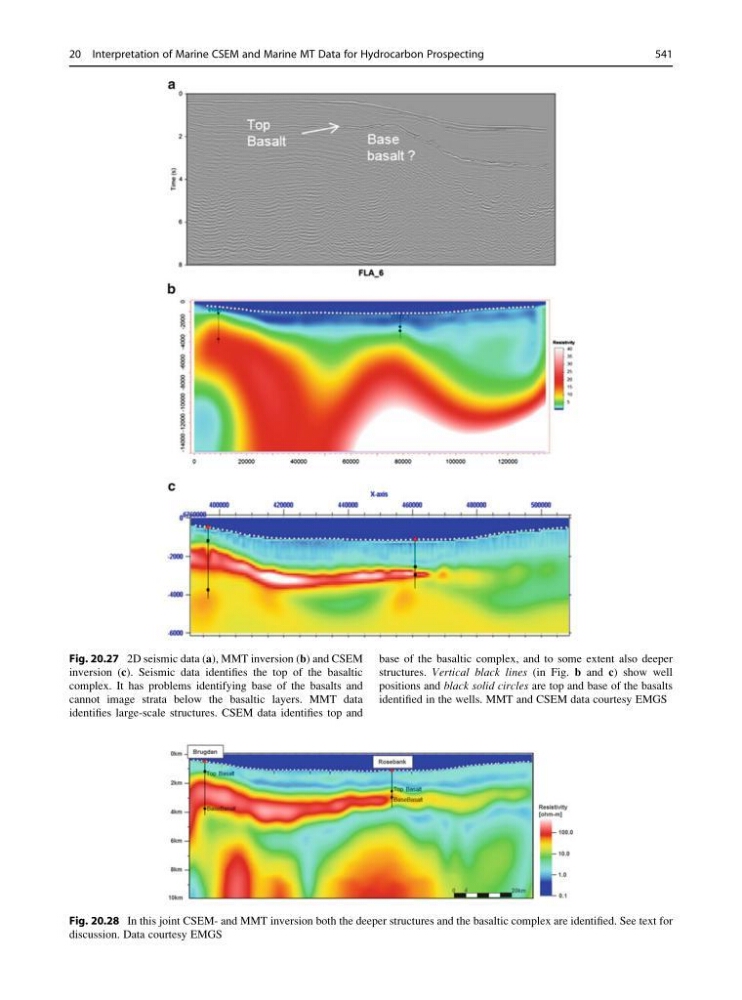
Fig. 20.27 2D seismic data (a), MMT inversion (b) and CSEM
inversion (c). Seismic data identifies the top of the basaltic
complex. It has problems identifying base of the basalts and
cannot image strata below the basaltic layers. MMT data
identifies large-scale structures. CSEM data identifies top and
base of the basaltic complex, and to some extent also deeper
structures. Vertical black lines (in Fig. b and c) show well
positions and black solid circles are top and base of the basalts
identified in the wells. MMT and CSEM data courtesy EMGS
Fig. 20.28 In this joint CSEM- and MMT inversion both the deeper structures and the basaltic complex are identified. See text for
discussion. Data courtesy EMGS
20 Interpretation of Marine CSEM and Marine MT Data for Hydrocarbon Prospecting
541
inversion (c). Seismic data identifies the top of the basaltic
complex. It has problems identifying base of the basalts and
cannot image strata below the basaltic layers. MMT data
identifies large-scale structures. CSEM data identifies top and
base of the basaltic complex, and to some extent also deeper
structures. Vertical black lines (in Fig. b and c) show well
positions and black solid circles are top and base of the basalts
identified in the wells. MMT and CSEM data courtesy EMGS
Fig. 20.28 In this joint CSEM- and MMT inversion both the deeper structures and the basaltic complex are identified. See text for
discussion. Data courtesy EMGS
20 Interpretation of Marine CSEM and Marine MT Data for Hydrocarbon Prospecting
541