

CSEM sounding is here used to map the electrical
properties in the upper part of the succession, and
MMT is used to map the deeper part. The electromagnetic data is acquired along a profile from the
Rosebank Field in the UK sector to the Brugdan prospect in the Faroe sector (Fig. 20.26)
20.7.2 Results
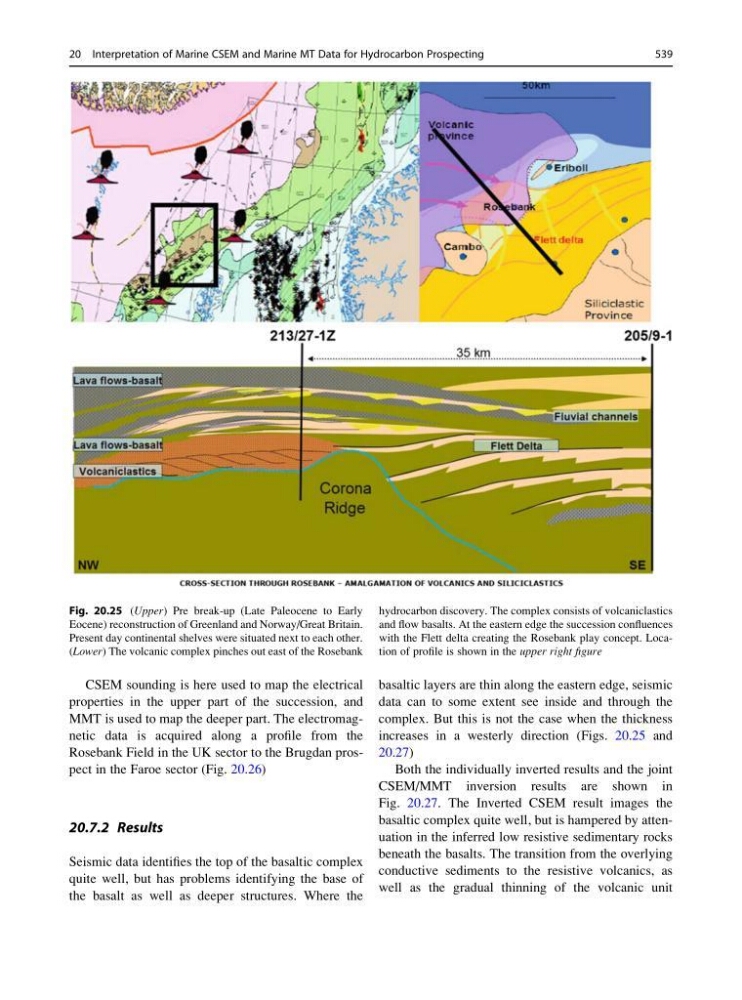
Seismic data identifies the top of the basaltic complex
quite well, but has problems identifying the base of
the basalt as well as deeper structures. Where the
basaltic layers are thin along the eastern edge, seismic
data can to some extent see inside and through the
complex. But this is not the case when the thickness
increases in a westerly direction (Figs. 20.25 and
20.27)
Both the individually inverted results and the joint
CSEM/MMT inversion results are shown in
Fig. 20.27. The Inverted CSEM result images the
basaltic complex quite well, but is hampered by attenuation in the inferred low resistive sedimentary rocks
beneath the basalts. The transition from the overlying
conductive sediments to the resistive volcanics, as
well as the gradual thinning of the volcanic unit
Fig. 20.25 (Upper) Pre break-up (Late Paleocene to Early
Eocene) reconstruction of Greenland and Norway/Great Britain.
Present day continental shelves were situated next to each other.
(Lower) The volcanic complex pinches out east of the Rosebank
hydrocarbon discovery. The complex consists of volcaniclastics
and flow basalts. At the eastern edge the succession confluences
with the Flett delta creating the Rosebank play concept. Location of profile is shown in the upper right figure
20 Interpretation of Marine CSEM and Marine MT Data for Hydrocarbon Prospecting
539
properties in the upper part of the succession, and
MMT is used to map the deeper part. The electromagnetic data is acquired along a profile from the
Rosebank Field in the UK sector to the Brugdan prospect in the Faroe sector (Fig. 20.26)
20.7.2 Results
Seismic data identifies the top of the basaltic complex
quite well, but has problems identifying the base of
the basalt as well as deeper structures. Where the
basaltic layers are thin along the eastern edge, seismic
data can to some extent see inside and through the
complex. But this is not the case when the thickness
increases in a westerly direction (Figs. 20.25 and
20.27)
Both the individually inverted results and the joint
CSEM/MMT inversion results are shown in
Fig. 20.27. The Inverted CSEM result images the
basaltic complex quite well, but is hampered by attenuation in the inferred low resistive sedimentary rocks
beneath the basalts. The transition from the overlying
conductive sediments to the resistive volcanics, as
well as the gradual thinning of the volcanic unit
Fig. 20.25 (Upper) Pre break-up (Late Paleocene to Early
Eocene) reconstruction of Greenland and Norway/Great Britain.
Present day continental shelves were situated next to each other.
(Lower) The volcanic complex pinches out east of the Rosebank
hydrocarbon discovery. The complex consists of volcaniclastics
and flow basalts. At the eastern edge the succession confluences
with the Flett delta creating the Rosebank play concept. Location of profile is shown in the upper right figure
20 Interpretation of Marine CSEM and Marine MT Data for Hydrocarbon Prospecting
539