

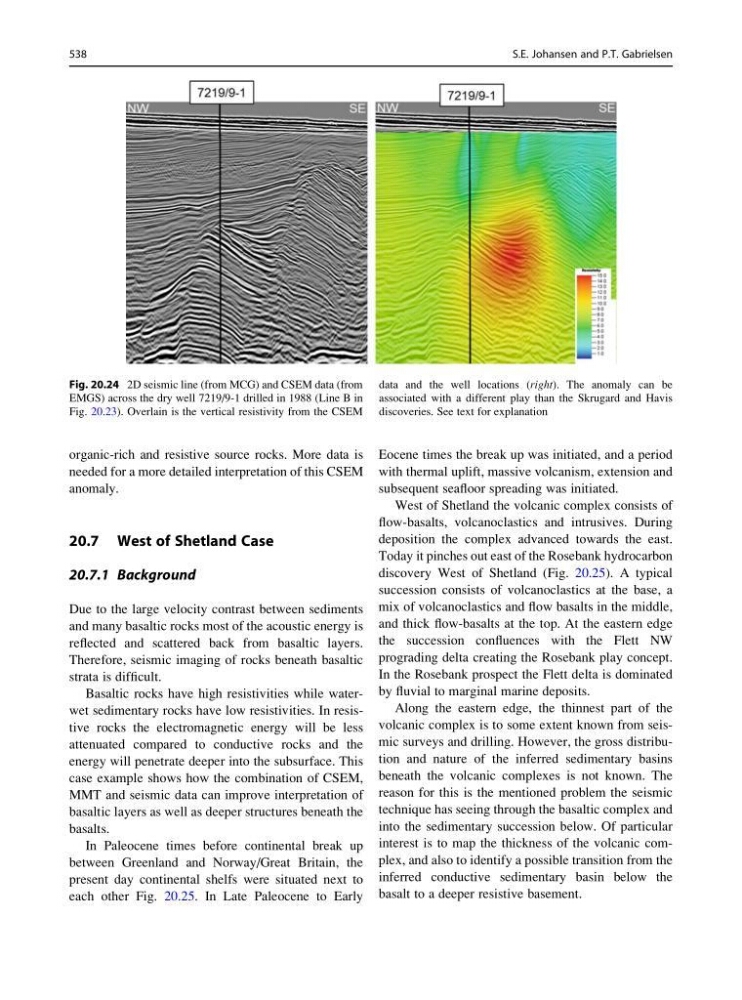
organic-rich and resistive source rocks. More data is
needed for a more detailed interpretation of this CSEM
anomaly.
20.7 West of Shetland Case
20.7.1 Background
Due to the large velocity contrast between sediments
and many basaltic rocks most of the acoustic energy is
reflected and scattered back from basaltic layers.
Therefore, seismic imaging of rocks beneath basaltic
strata is difficult.
Basaltic rocks have high resistivities while waterwet sedimentary rocks have low resistivities. In resistive rocks the electromagnetic energy will be less
attenuated compared to conductive rocks and the
energy will penetrate deeper into the subsurface. This
case example shows how the combination of CSEM,
MMT and seismic data can improve interpretation of
basaltic layers as well as deeper structures beneath the
basalts.
In Paleocene times before continental break up
between Greenland and Norway/Great Britain, the
present day continental shelfs were situated next to
each other Fig. 20.25. In Late Paleocene to Early
Eocene times the break up was initiated, and a period
with thermal uplift, massive volcanism, extension and
subsequent seafloor spreading was initiated.
West of Shetland the volcanic complex consists of
flow-basalts, volcanoclastics and intrusives. During
deposition the complex advanced towards the east.
Today it pinches out east of the Rosebank hydrocarbon
discovery West of Shetland (Fig. 20.25). A typical
succession consists of volcanoclastics at the base, a
mix of volcanoclastics and flow basalts in the middle,
and thick flow-basalts at the top. At the eastern edge
the succession confluences with the Flett NW
prograding delta creating the Rosebank play concept.
In the Rosebank prospect the Flett delta is dominated
by fluvial to marginal marine deposits.
Along the eastern edge, the thinnest part of the
volcanic complex is to some extent known from seismic surveys and drilling. However, the gross distribution and nature of the inferred sedimentary basins
beneath the volcanic complexes is not known. The
reason for this is the mentioned problem the seismic
technique has seeing through the basaltic complex and
into the sedimentary succession below. Of particular
interest is to map the thickness of the volcanic complex, and also to identify a possible transition from the
inferred conductive sedimentary basin below the
basalt to a deeper resistive basement.
Fig. 20.24 2D seismic line (from MCG) and CSEM data (from
EMGS) across the dry well 7219/9-1 drilled in 1988 (Line B in
Fig. 20.23). Overlain is the vertical resistivity from the CSEM
data and the well locations (right). The anomaly can be
associated with a different play than the Skrugard and Havis
discoveries. See text for explanation
538
S.E. Johansen and P.T. Gabrielsen
needed for a more detailed interpretation of this CSEM
anomaly.
20.7 West of Shetland Case
20.7.1 Background
Due to the large velocity contrast between sediments
and many basaltic rocks most of the acoustic energy is
reflected and scattered back from basaltic layers.
Therefore, seismic imaging of rocks beneath basaltic
strata is difficult.
Basaltic rocks have high resistivities while waterwet sedimentary rocks have low resistivities. In resistive rocks the electromagnetic energy will be less
attenuated compared to conductive rocks and the
energy will penetrate deeper into the subsurface. This
case example shows how the combination of CSEM,
MMT and seismic data can improve interpretation of
basaltic layers as well as deeper structures beneath the
basalts.
In Paleocene times before continental break up
between Greenland and Norway/Great Britain, the
present day continental shelfs were situated next to
each other Fig. 20.25. In Late Paleocene to Early
Eocene times the break up was initiated, and a period
with thermal uplift, massive volcanism, extension and
subsequent seafloor spreading was initiated.
West of Shetland the volcanic complex consists of
flow-basalts, volcanoclastics and intrusives. During
deposition the complex advanced towards the east.
Today it pinches out east of the Rosebank hydrocarbon
discovery West of Shetland (Fig. 20.25). A typical
succession consists of volcanoclastics at the base, a
mix of volcanoclastics and flow basalts in the middle,
and thick flow-basalts at the top. At the eastern edge
the succession confluences with the Flett NW
prograding delta creating the Rosebank play concept.
In the Rosebank prospect the Flett delta is dominated
by fluvial to marginal marine deposits.
Along the eastern edge, the thinnest part of the
volcanic complex is to some extent known from seismic surveys and drilling. However, the gross distribution and nature of the inferred sedimentary basins
beneath the volcanic complexes is not known. The
reason for this is the mentioned problem the seismic
technique has seeing through the basaltic complex and
into the sedimentary succession below. Of particular
interest is to map the thickness of the volcanic complex, and also to identify a possible transition from the
inferred conductive sedimentary basin below the
basalt to a deeper resistive basement.
Fig. 20.24 2D seismic line (from MCG) and CSEM data (from
EMGS) across the dry well 7219/9-1 drilled in 1988 (Line B in
Fig. 20.23). Overlain is the vertical resistivity from the CSEM
data and the well locations (right). The anomaly can be
associated with a different play than the Skrugard and Havis
discoveries. See text for explanation
538
S.E. Johansen and P.T. Gabrielsen