

smaller if oil, instead of gas, is present in the reservoir.
If a HC-saturated reservoir is to be detected by the
CSEM method the hydrocarbon saturation has to be
high. It must reach 40–60% before the resistivity will
significantly increase (Fig. 20.19) and the reservoir
can be detected by CSEM sounding. Oil and gas will
have similar effects and both will increase the resistivity in the reservoir. As a result of this it is challenging
for the CSEM method to distinguish between different
HC phases in the subsurface.
The relationships and properties mentioned above
have implications for interpretation of a given HC
prospect. If both seismic data and CSEM data show
indications of increased hydrocarbon saturation the
chance to find a reservoir with hydrocarbons is significant. If only the seismic data shows indication of
hydrocarbon the chance to find a high saturation reservoir is reduced. The evaluation will depend on the
expected fluid response in the seismic data. If only
the CSEM data shows indications of high resistivity,
with no hydrocarbon indications in the seismic data,
lithology and other non-HC interpretations should also
be carefully evaluated.
This Pemex case study demonstrates how seismicand CSEM data can be used as a combined DHI tool
for better HC prediction. The prospect is located in
3.5
3.0
2.5
2.0
1.5
1.0
0.5
0.0
10000
9000
8000
7000
6000
5000
4000
3000
2000
1000
0
Offset (m)
3.5
3.0
2.5
2.0
1.5
1.0
0.5
0.0
0
5000
10000
15000
20000
25000
1800
1600
1400
1200
1000
800
600
400
200
0
1
5
10
15
20
24
Water
Sediments
TWGP
Horizontal Distance (m)
Depth below Sea level (m)
Normalised magnitudes
Normalised magnitude
at 6.5 km offset
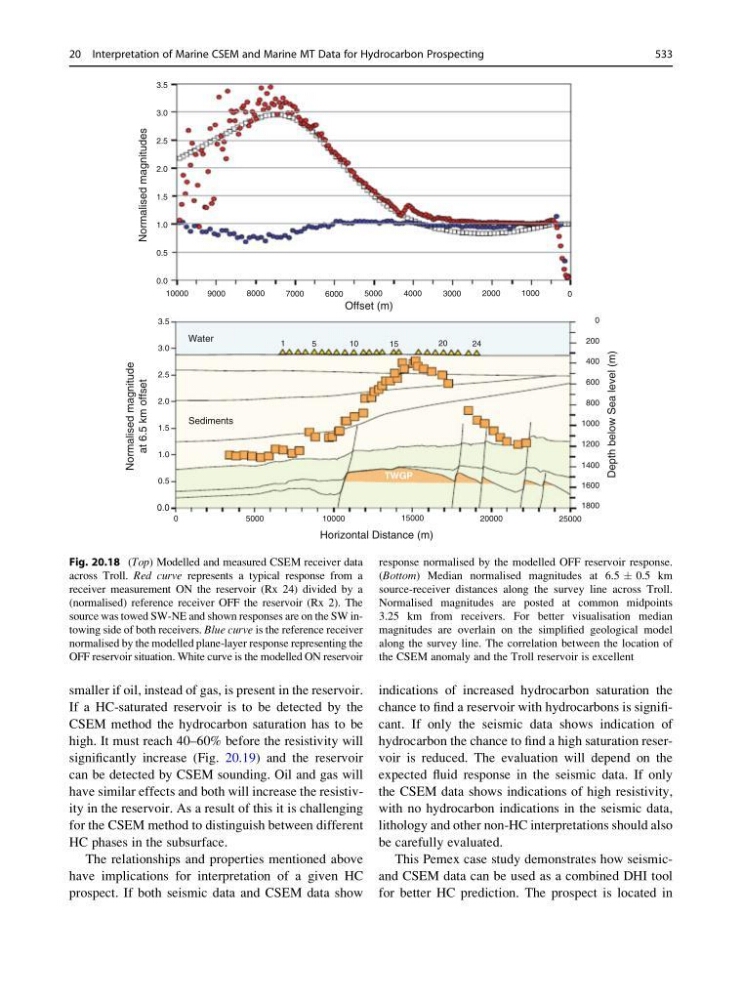
Fig. 20.18 (Top) Modelled and measured CSEM receiver data
across Troll. Red curve represents a typical response from a
receiver measurement ON the reservoir (Rx 24) divided by a
(normalised) reference receiver OFF the reservoir (Rx 2). The
source was towed SW-NE and shown responses are on the SW intowing side of both receivers. Blue curve is the reference receiver
normalised by the modelled plane-layer response representing the
OFF reservoir situation. White curve is the modelled ON reservoir
response normalised by the modelled OFF reservoir response.
(Bottom) Median normalised magnitudes at 6.5 Æ 0.5 km
source-receiver distances along the survey line across Troll.
Normalised magnitudes are posted at common midpoints
3.25 km from receivers. For better visualisation median
magnitudes are overlain on the simplified geological model
along the survey line. The correlation between the location of
the CSEM anomaly and the Troll reservoir is excellent
20 Interpretation of Marine CSEM and Marine MT Data for Hydrocarbon Prospecting
533
If a HC-saturated reservoir is to be detected by the
CSEM method the hydrocarbon saturation has to be
high. It must reach 40–60% before the resistivity will
significantly increase (Fig. 20.19) and the reservoir
can be detected by CSEM sounding. Oil and gas will
have similar effects and both will increase the resistivity in the reservoir. As a result of this it is challenging
for the CSEM method to distinguish between different
HC phases in the subsurface.
The relationships and properties mentioned above
have implications for interpretation of a given HC
prospect. If both seismic data and CSEM data show
indications of increased hydrocarbon saturation the
chance to find a reservoir with hydrocarbons is significant. If only the seismic data shows indication of
hydrocarbon the chance to find a high saturation reservoir is reduced. The evaluation will depend on the
expected fluid response in the seismic data. If only
the CSEM data shows indications of high resistivity,
with no hydrocarbon indications in the seismic data,
lithology and other non-HC interpretations should also
be carefully evaluated.
This Pemex case study demonstrates how seismicand CSEM data can be used as a combined DHI tool
for better HC prediction. The prospect is located in
3.5
3.0
2.5
2.0
1.5
1.0
0.5
0.0
10000
9000
8000
7000
6000
5000
4000
3000
2000
1000
0
Offset (m)
3.5
3.0
2.5
2.0
1.5
1.0
0.5
0.0
0
5000
10000
15000
20000
25000
1800
1600
1400
1200
1000
800
600
400
200
0
1
5
10
15
20
24
Water
Sediments
TWGP
Horizontal Distance (m)
Depth below Sea level (m)
Normalised magnitudes
Normalised magnitude
at 6.5 km offset
Fig. 20.18 (Top) Modelled and measured CSEM receiver data
across Troll. Red curve represents a typical response from a
receiver measurement ON the reservoir (Rx 24) divided by a
(normalised) reference receiver OFF the reservoir (Rx 2). The
source was towed SW-NE and shown responses are on the SW intowing side of both receivers. Blue curve is the reference receiver
normalised by the modelled plane-layer response representing the
OFF reservoir situation. White curve is the modelled ON reservoir
response normalised by the modelled OFF reservoir response.
(Bottom) Median normalised magnitudes at 6.5 Æ 0.5 km
source-receiver distances along the survey line across Troll.
Normalised magnitudes are posted at common midpoints
3.25 km from receivers. For better visualisation median
magnitudes are overlain on the simplified geological model
along the survey line. The correlation between the location of
the CSEM anomaly and the Troll reservoir is excellent
20 Interpretation of Marine CSEM and Marine MT Data for Hydrocarbon Prospecting
533