

The geological models and results from the
modelling are shown in Fig. 20.17. Average resistivity
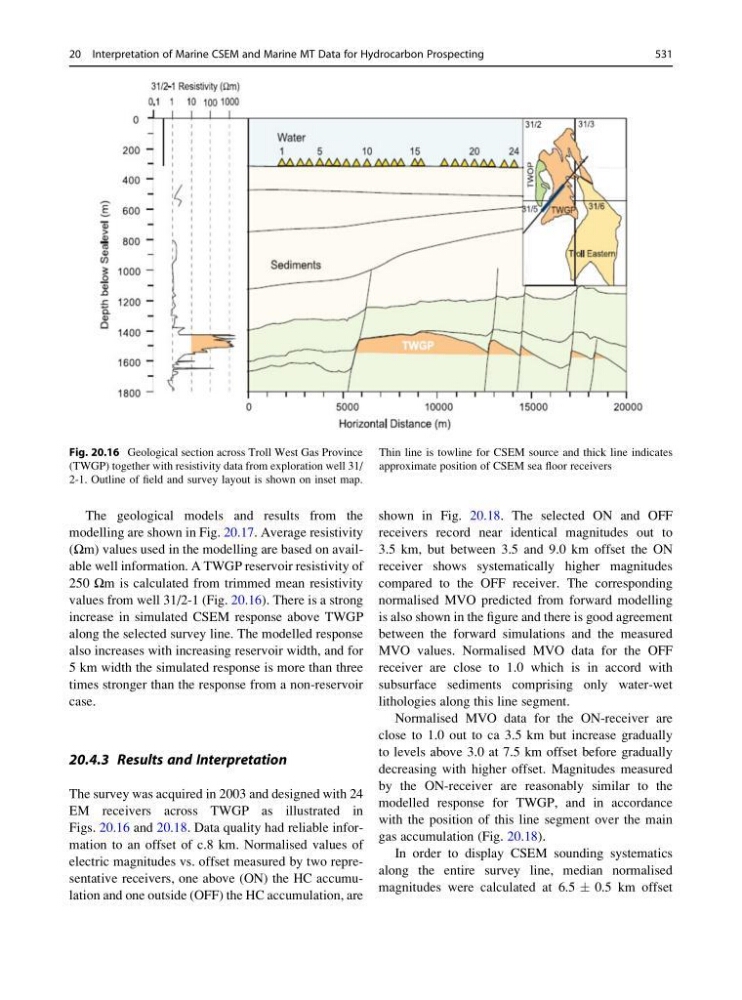
(Ωm) values used in the modelling are based on available well information. A TWGP reservoir resistivity of
250 Ωm is calculated from trimmed mean resistivity
values from well 31/2-1 (Fig. 20.16). There is a strong
increase in simulated CSEM response above TWGP
along the selected survey line. The modelled response
also increases with increasing reservoir width, and for
5 km width the simulated response is more than three
times stronger than the response from a non-reservoir
case.
20.4.3 Results and Interpretation
The survey was acquired in 2003 and designed with 24
EM receivers across TWGP as illustrated in
Figs. 20.16 and 20.18. Data quality had reliable information to an offset of c.8 km. Normalised values of
electric magnitudes vs. offset measured by two representative receivers, one above (ON) the HC accumulation and one outside (OFF) the HC accumulation, are
shown in Fig. 20.18. The selected ON and OFF
receivers record near identical magnitudes out to
3.5 km, but between 3.5 and 9.0 km offset the ON
receiver shows systematically higher magnitudes
compared to the OFF receiver. The corresponding
normalised MVO predicted from forward modelling
is also shown in the figure and there is good agreement
between the forward simulations and the measured
MVO values. Normalised MVO data for the OFF
receiver are close to 1.0 which is in accord with
subsurface sediments comprising only water-wet
lithologies along this line segment.
Normalised MVO data for the ON-receiver are
close to 1.0 out to ca 3.5 km but increase gradually
to levels above 3.0 at 7.5 km offset before gradually
decreasing with higher offset. Magnitudes measured
by the ON-receiver are reasonably similar to the
modelled response for TWGP, and in accordance
with the position of this line segment over the main
gas accumulation (Fig. 20.18).
In order to display CSEM sounding systematics
along the entire survey line, median normalised
magnitudes were calculated at 6.5 Æ 0.5 km offset
Fig. 20.16 Geological section across Troll West Gas Province
(TWGP) together with resistivity data from exploration well 31/
2-1. Outline of field and survey layout is shown on inset map.
Thin line is towline for CSEM source and thick line indicates
approximate position of CSEM sea floor receivers
20 Interpretation of Marine CSEM and Marine MT Data for Hydrocarbon Prospecting
531
modelling are shown in Fig. 20.17. Average resistivity
(Ωm) values used in the modelling are based on available well information. A TWGP reservoir resistivity of
250 Ωm is calculated from trimmed mean resistivity
values from well 31/2-1 (Fig. 20.16). There is a strong
increase in simulated CSEM response above TWGP
along the selected survey line. The modelled response
also increases with increasing reservoir width, and for
5 km width the simulated response is more than three
times stronger than the response from a non-reservoir
case.
20.4.3 Results and Interpretation
The survey was acquired in 2003 and designed with 24
EM receivers across TWGP as illustrated in
Figs. 20.16 and 20.18. Data quality had reliable information to an offset of c.8 km. Normalised values of
electric magnitudes vs. offset measured by two representative receivers, one above (ON) the HC accumulation and one outside (OFF) the HC accumulation, are
shown in Fig. 20.18. The selected ON and OFF
receivers record near identical magnitudes out to
3.5 km, but between 3.5 and 9.0 km offset the ON
receiver shows systematically higher magnitudes
compared to the OFF receiver. The corresponding
normalised MVO predicted from forward modelling
is also shown in the figure and there is good agreement
between the forward simulations and the measured
MVO values. Normalised MVO data for the OFF
receiver are close to 1.0 which is in accord with
subsurface sediments comprising only water-wet
lithologies along this line segment.
Normalised MVO data for the ON-receiver are
close to 1.0 out to ca 3.5 km but increase gradually
to levels above 3.0 at 7.5 km offset before gradually
decreasing with higher offset. Magnitudes measured
by the ON-receiver are reasonably similar to the
modelled response for TWGP, and in accordance
with the position of this line segment over the main
gas accumulation (Fig. 20.18).
In order to display CSEM sounding systematics
along the entire survey line, median normalised
magnitudes were calculated at 6.5 Æ 0.5 km offset
Fig. 20.16 Geological section across Troll West Gas Province
(TWGP) together with resistivity data from exploration well 31/
2-1. Outline of field and survey layout is shown on inset map.
Thin line is towline for CSEM source and thick line indicates
approximate position of CSEM sea floor receivers
20 Interpretation of Marine CSEM and Marine MT Data for Hydrocarbon Prospecting
531