

EM signal by the factor e
À1 (appr. 0.37) is defined as
the skin depth (%503
p ρ
f [m]). It is about 551 m in
seawater (0.3 Ωm) and 1423 m in 2 Ωm sediment and
10
8 m in air (10
10
Ωm) for a 0.25 Hz signal. EM
signals are rapidly attenuated in seawater and seafloor
sediments saturated with saline water, and these signal
pathways will dominate at near source-to-receiver
offsets (~3 km). In high resistivity and relatively thin
(20–200 m) subsurface media, such as hydrocarbon
filled reservoirs (30–500 Ωm), the energy is guided
along the layers and attenuated less depending on the
property of the layer. Guided EM energy is constantly
leaking back to the seafloor and is recorded by the EM
receivers. Energy is also refracted along the air/water
interface. This energy is commonly termed the airwave and dominates at far offsets depending on
water depth and the subsurface resistivity. The
refracted energy from high resistivity subsurface
layers will dominate over directly transmitted energy
when the source-receiver distance is comparable to
twice the depth to this layer. The detection of this
guided and refracted energy is the basis of CSEM as
used when exploring for thin HC layers.
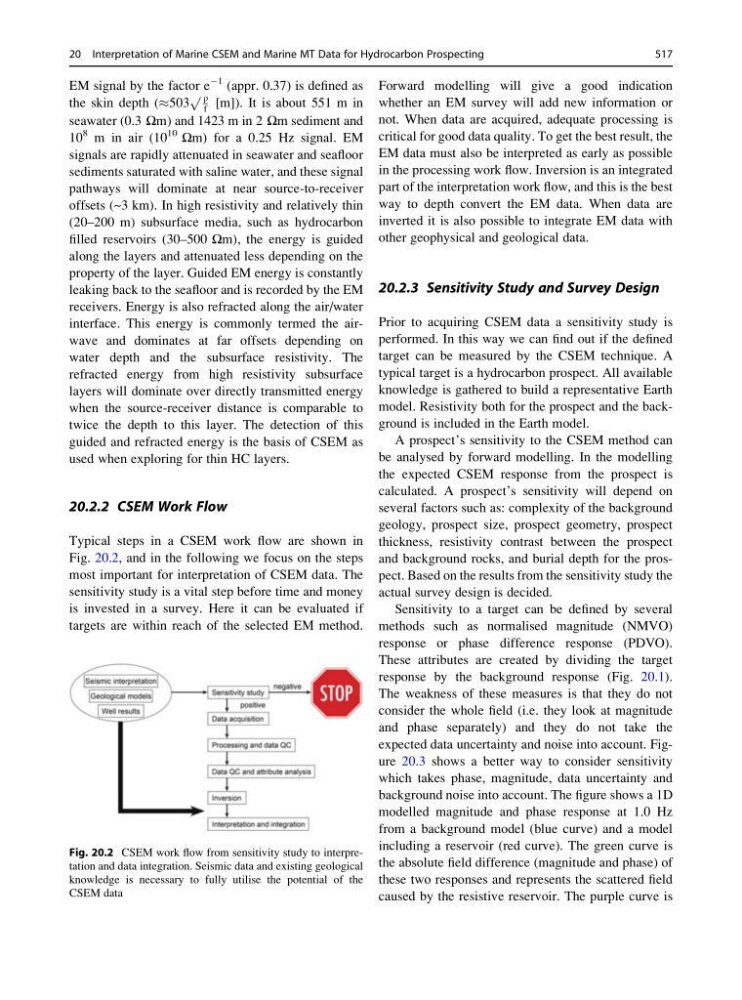
20.2.2 CSEM Work Flow
Typical steps in a CSEM work flow are shown in
Fig. 20.2, and in the following we focus on the steps
most important for interpretation of CSEM data. The
sensitivity study is a vital step before time and money
is invested in a survey. Here it can be evaluated if
targets are within reach of the selected EM method.
Forward modelling will give a good indication
whether an EM survey will add new information or
not. When data are acquired, adequate processing is
critical for good data quality. To get the best result, the
EM data must also be interpreted as early as possible
in the processing work flow. Inversion is an integrated
part of the interpretation work flow, and this is the best
way to depth convert the EM data. When data are
inverted it is also possible to integrate EM data with
other geophysical and geological data.
20.2.3 Sensitivity Study and Survey Design
Prior to acquiring CSEM data a sensitivity study is
performed. In this way we can find out if the defined
target can be measured by the CSEM technique. A
typical target is a hydrocarbon prospect. All available
knowledge is gathered to build a representative Earth
model. Resistivity both for the prospect and the background is included in the Earth model.
A prospect’s sensitivity to the CSEM method can
be analysed by forward modelling. In the modelling
the expected CSEM response from the prospect is
calculated. A prospect’s sensitivity will depend on
several factors such as: complexity of the background
geology, prospect size, prospect geometry, prospect
thickness, resistivity contrast between the prospect
and background rocks, and burial depth for the prospect. Based on the results from the sensitivity study the
actual survey design is decided.
Sensitivity to a target can be defined by several
methods such as normalised magnitude (NMVO)
response or phase difference response (PDVO).
These attributes are created by dividing the target
response by the background response (Fig. 20.1).
The weakness of these measures is that they do not
consider the whole field (i.e. they look at magnitude
and phase separately) and they do not take the
expected data uncertainty and noise into account. Figure 20.3 shows a better way to consider sensitivity
which takes phase, magnitude, data uncertainty and
background noise into account. The figure shows a 1D
modelled magnitude and phase response at 1.0 Hz
from a background model (blue curve) and a model
including a reservoir (red curve). The green curve is
the absolute field difference (magnitude and phase) of
these two responses and represents the scattered field
caused by the resistive reservoir. The purple curve is
Fig. 20.2 CSEM work flow from sensitivity study to interpretation and data integration. Seismic data and existing geological
knowledge is necessary to fully utilise the potential of the
CSEM data
20 Interpretation of Marine CSEM and Marine MT Data for Hydrocarbon Prospecting
517
À1 (appr. 0.37) is defined as
the skin depth (%503
p ρ
f [m]). It is about 551 m in
seawater (0.3 Ωm) and 1423 m in 2 Ωm sediment and
10
8 m in air (10
10
Ωm) for a 0.25 Hz signal. EM
signals are rapidly attenuated in seawater and seafloor
sediments saturated with saline water, and these signal
pathways will dominate at near source-to-receiver
offsets (~3 km). In high resistivity and relatively thin
(20–200 m) subsurface media, such as hydrocarbon
filled reservoirs (30–500 Ωm), the energy is guided
along the layers and attenuated less depending on the
property of the layer. Guided EM energy is constantly
leaking back to the seafloor and is recorded by the EM
receivers. Energy is also refracted along the air/water
interface. This energy is commonly termed the airwave and dominates at far offsets depending on
water depth and the subsurface resistivity. The
refracted energy from high resistivity subsurface
layers will dominate over directly transmitted energy
when the source-receiver distance is comparable to
twice the depth to this layer. The detection of this
guided and refracted energy is the basis of CSEM as
used when exploring for thin HC layers.
20.2.2 CSEM Work Flow
Typical steps in a CSEM work flow are shown in
Fig. 20.2, and in the following we focus on the steps
most important for interpretation of CSEM data. The
sensitivity study is a vital step before time and money
is invested in a survey. Here it can be evaluated if
targets are within reach of the selected EM method.
Forward modelling will give a good indication
whether an EM survey will add new information or
not. When data are acquired, adequate processing is
critical for good data quality. To get the best result, the
EM data must also be interpreted as early as possible
in the processing work flow. Inversion is an integrated
part of the interpretation work flow, and this is the best
way to depth convert the EM data. When data are
inverted it is also possible to integrate EM data with
other geophysical and geological data.
20.2.3 Sensitivity Study and Survey Design
Prior to acquiring CSEM data a sensitivity study is
performed. In this way we can find out if the defined
target can be measured by the CSEM technique. A
typical target is a hydrocarbon prospect. All available
knowledge is gathered to build a representative Earth
model. Resistivity both for the prospect and the background is included in the Earth model.
A prospect’s sensitivity to the CSEM method can
be analysed by forward modelling. In the modelling
the expected CSEM response from the prospect is
calculated. A prospect’s sensitivity will depend on
several factors such as: complexity of the background
geology, prospect size, prospect geometry, prospect
thickness, resistivity contrast between the prospect
and background rocks, and burial depth for the prospect. Based on the results from the sensitivity study the
actual survey design is decided.
Sensitivity to a target can be defined by several
methods such as normalised magnitude (NMVO)
response or phase difference response (PDVO).
These attributes are created by dividing the target
response by the background response (Fig. 20.1).
The weakness of these measures is that they do not
consider the whole field (i.e. they look at magnitude
and phase separately) and they do not take the
expected data uncertainty and noise into account. Figure 20.3 shows a better way to consider sensitivity
which takes phase, magnitude, data uncertainty and
background noise into account. The figure shows a 1D
modelled magnitude and phase response at 1.0 Hz
from a background model (blue curve) and a model
including a reservoir (red curve). The green curve is
the absolute field difference (magnitude and phase) of
these two responses and represents the scattered field
caused by the resistive reservoir. The purple curve is
Fig. 20.2 CSEM work flow from sensitivity study to interpretation and data integration. Seismic data and existing geological
knowledge is necessary to fully utilise the potential of the
CSEM data
20 Interpretation of Marine CSEM and Marine MT Data for Hydrocarbon Prospecting
517