

repeatability level: smaller source arrays, more
variability in streamer sensitivity and shallower
towing depth (causing more noise in rough weather)
are some of them.
Figure 19.32 shows a systematic estimation of time
shifts using offsets ranging from 1000 m to 1150 m
(Zadeh and Landrø 2011). Despite some scatter in the
time shift estimates, we observe a clear increase close
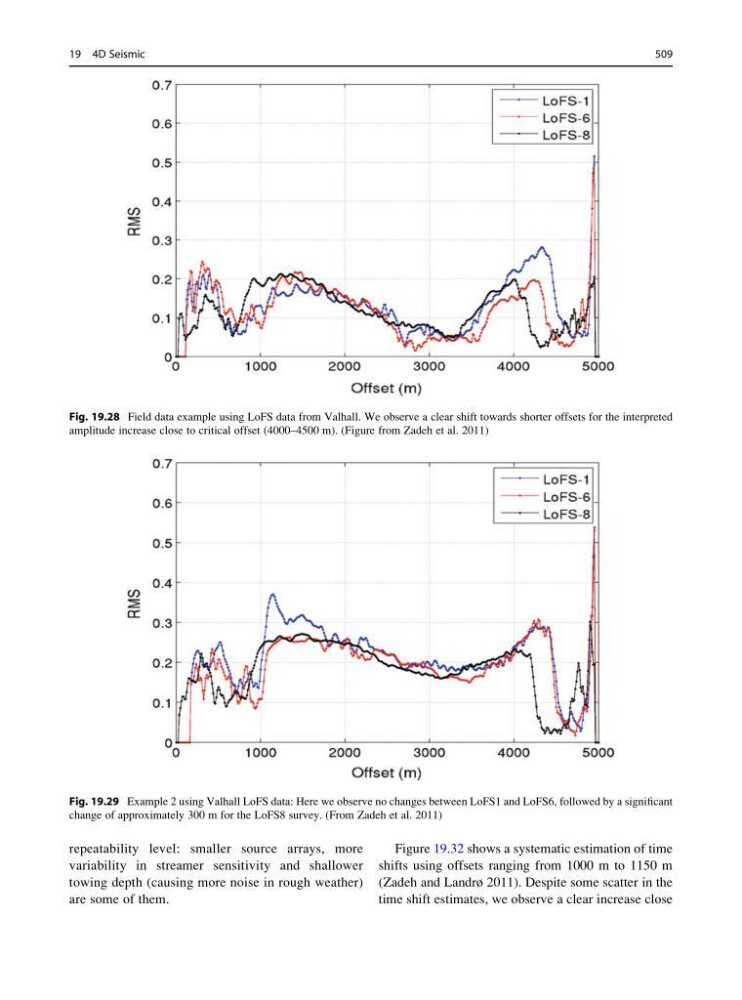
Fig. 19.28 Field data example using LoFS data from Valhall. We observe a clear shift towards shorter offsets for the interpreted
amplitude increase close to critical offset (4000–4500 m). (Figure from Zadeh et al. 2011)
Fig. 19.29 Example 2 using Valhall LoFS data: Here we observe no changes between LoFS1 and LoFS6, followed by a significant
change of approximately 300 m for the LoFS8 survey. (From Zadeh et al. 2011)
19 4D Seismic
509
variability in streamer sensitivity and shallower
towing depth (causing more noise in rough weather)
are some of them.
Figure 19.32 shows a systematic estimation of time
shifts using offsets ranging from 1000 m to 1150 m
(Zadeh and Landrø 2011). Despite some scatter in the
time shift estimates, we observe a clear increase close
Fig. 19.28 Field data example using LoFS data from Valhall. We observe a clear shift towards shorter offsets for the interpreted
amplitude increase close to critical offset (4000–4500 m). (Figure from Zadeh et al. 2011)
Fig. 19.29 Example 2 using Valhall LoFS data: Here we observe no changes between LoFS1 and LoFS6, followed by a significant
change of approximately 300 m for the LoFS8 survey. (From Zadeh et al. 2011)
19 4D Seismic
509