

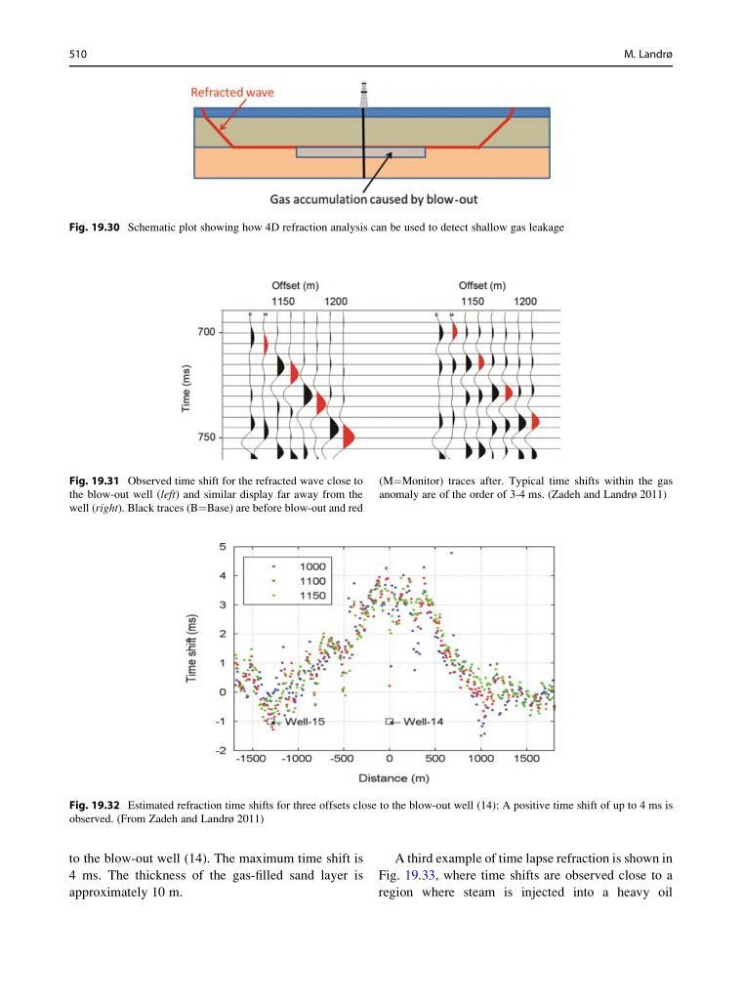
to the blow-out well (14). The maximum time shift is
4 ms. The thickness of the gas-filled sand layer is
approximately 10 m.
A third example of time lapse refraction is shown in
Fig. 19.33, where time shifts are observed close to a
region where steam is injected into a heavy oil
Fig. 19.31 Observed time shift for the refracted wave close to
the blow-out well (left) and similar display far away from the
well (right). Black traces (B¼Base) are before blow-out and red
(M¼Monitor) traces after. Typical time shifts within the gas
anomaly are of the order of 3-4 ms. (Zadeh and Landrø 2011)
Fig. 19.30 Schematic plot showing how 4D refraction analysis can be used to detect shallow gas leakage
Fig. 19.32 Estimated refraction time shifts for three offsets close to the blow-out well (14): A positive time shift of up to 4 ms is
observed. (From Zadeh and Landrø 2011)
510
M. Landrø
4 ms. The thickness of the gas-filled sand layer is
approximately 10 m.
A third example of time lapse refraction is shown in
Fig. 19.33, where time shifts are observed close to a
region where steam is injected into a heavy oil
Fig. 19.31 Observed time shift for the refracted wave close to
the blow-out well (left) and similar display far away from the
well (right). Black traces (B¼Base) are before blow-out and red
(M¼Monitor) traces after. Typical time shifts within the gas
anomaly are of the order of 3-4 ms. (Zadeh and Landrø 2011)
Fig. 19.30 Schematic plot showing how 4D refraction analysis can be used to detect shallow gas leakage
Fig. 19.32 Estimated refraction time shifts for three offsets close to the blow-out well (14): A positive time shift of up to 4 ms is
observed. (From Zadeh and Landrø 2011)
510
M. Landrø