

19.10 CO 2 Monitoring
This text is taken from the paper “Quantitative Seismic Monitoring Methods” by Landrø (2008), in
ERCIM News 74, pp. 16–17:
Interest in CO 2 injection, both for storage and as a
tertiary recovery method for increased hydrocarbon
production, has grown significantly over the last
decade. Statoil has stored approximately 10 million
tons of CO 2 in the Utsira Formation at the Sleipner
Field, and several similar projects are now being
launched worldwide. At NTNU our focus has been to
develop geophysical methods to monitor the CO 2 -
injection process, and particularly to try to quantify
the volume injected directly from geophysical data.
One way to improve our understanding of how the
CO 2 flows in a porous rock is to perform small-scale
flooding experiments on long core samples. Such
experiments involve injecting various fluids in the
end of a 30–40 cm long core (Fig. 19.24). An example of such a flooding experiment and corresponding
X-ray images for various flooding patterns is shown
in Fig. 19.24. By measuring acoustic velocities as the
flooding experiment is conducted, these experiments
can be used to establish a link between pore-scale
CO 2 -injection and time-lapse seismic on the field
scale.
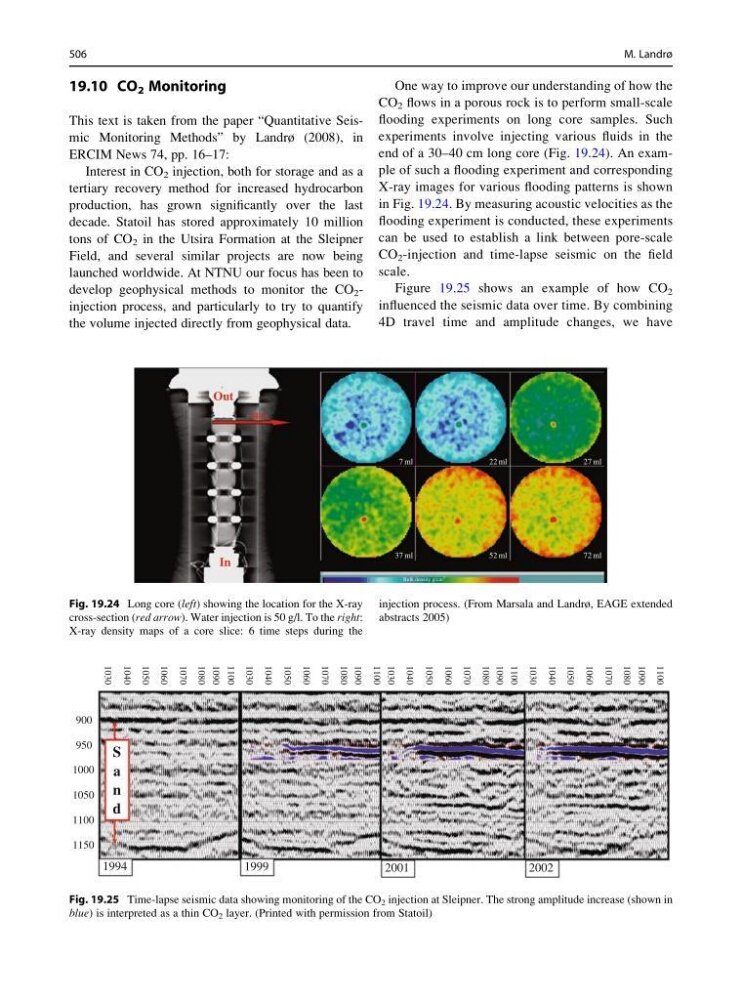
Figure 19.25 shows an example of how CO 2
influenced the seismic data over time. By combining
4D travel time and amplitude changes, we have
7 ml
22 ml
27 ml
37 ml
In
Out
Slice
Bulk density g/cm 3
52 ml
72 ml
Fig. 19.24 Long core (left) showing the location for the X-ray
cross-section (red arrow). Water injection is 50 g/l. To the right:
X-ray density maps of a core slice: 6 time steps during the
injection process. (From Marsala and Landrø, EAGE extended
abstracts 2005)
900
1030
1040
1050
1060
1070
1080
1090
1100
1030
1040
1050
1060
1070
1080
1090
1100
1030
1040
1050
1060
1070
1080
1090
1100
1030
1040
1050
1060
1070
1080
1090
1100
950
1000
1050
1100
1150
S
a
n
d
1994
1999
2001
2002
Fig. 19.25 Time-lapse seismic data showing monitoring of the CO 2 injection at Sleipner. The strong amplitude increase (shown in
blue) is interpreted as a thin CO 2 layer. (Printed with permission from Statoil)
506
M. Landrø
This text is taken from the paper “Quantitative Seismic Monitoring Methods” by Landrø (2008), in
ERCIM News 74, pp. 16–17:
Interest in CO 2 injection, both for storage and as a
tertiary recovery method for increased hydrocarbon
production, has grown significantly over the last
decade. Statoil has stored approximately 10 million
tons of CO 2 in the Utsira Formation at the Sleipner
Field, and several similar projects are now being
launched worldwide. At NTNU our focus has been to
develop geophysical methods to monitor the CO 2 -
injection process, and particularly to try to quantify
the volume injected directly from geophysical data.
One way to improve our understanding of how the
CO 2 flows in a porous rock is to perform small-scale
flooding experiments on long core samples. Such
experiments involve injecting various fluids in the
end of a 30–40 cm long core (Fig. 19.24). An example of such a flooding experiment and corresponding
X-ray images for various flooding patterns is shown
in Fig. 19.24. By measuring acoustic velocities as the
flooding experiment is conducted, these experiments
can be used to establish a link between pore-scale
CO 2 -injection and time-lapse seismic on the field
scale.
Figure 19.25 shows an example of how CO 2
influenced the seismic data over time. By combining
4D travel time and amplitude changes, we have
7 ml
22 ml
27 ml
37 ml
In
Out
Slice
Bulk density g/cm 3
52 ml
72 ml
Fig. 19.24 Long core (left) showing the location for the X-ray
cross-section (red arrow). Water injection is 50 g/l. To the right:
X-ray density maps of a core slice: 6 time steps during the
injection process. (From Marsala and Landrø, EAGE extended
abstracts 2005)
900
1030
1040
1050
1060
1070
1080
1090
1100
1030
1040
1050
1060
1070
1080
1090
1100
1030
1040
1050
1060
1070
1080
1090
1100
1030
1040
1050
1060
1070
1080
1090
1100
950
1000
1050
1100
1150
S
a
n
d
1994
1999
2001
2002
Fig. 19.25 Time-lapse seismic data showing monitoring of the CO 2 injection at Sleipner. The strong amplitude increase (shown in
blue) is interpreted as a thin CO 2 layer. (Printed with permission from Statoil)
506
M. Landrø