

When the reservoir rock compacts, the over- and
underburden are stretched. This stretch is relatively
small (of the order of 0.1%), However, this produces
a small velocity decrease that is observable as
timeshifts on time-lapse seismic data. Typical
observations of seafloor subsidence show that the subsidence is less than the measured compaction for the
reservoir. The vertical movement of the seafloor is
typically less than that of the top reservoir (Settari
2002), though this is strongly dependent on reservoir
geometry and the stiffness of the rocks above and
below.
The most common way to interpret 4D seismic data
from a compacting reservoir is to use geomechanical
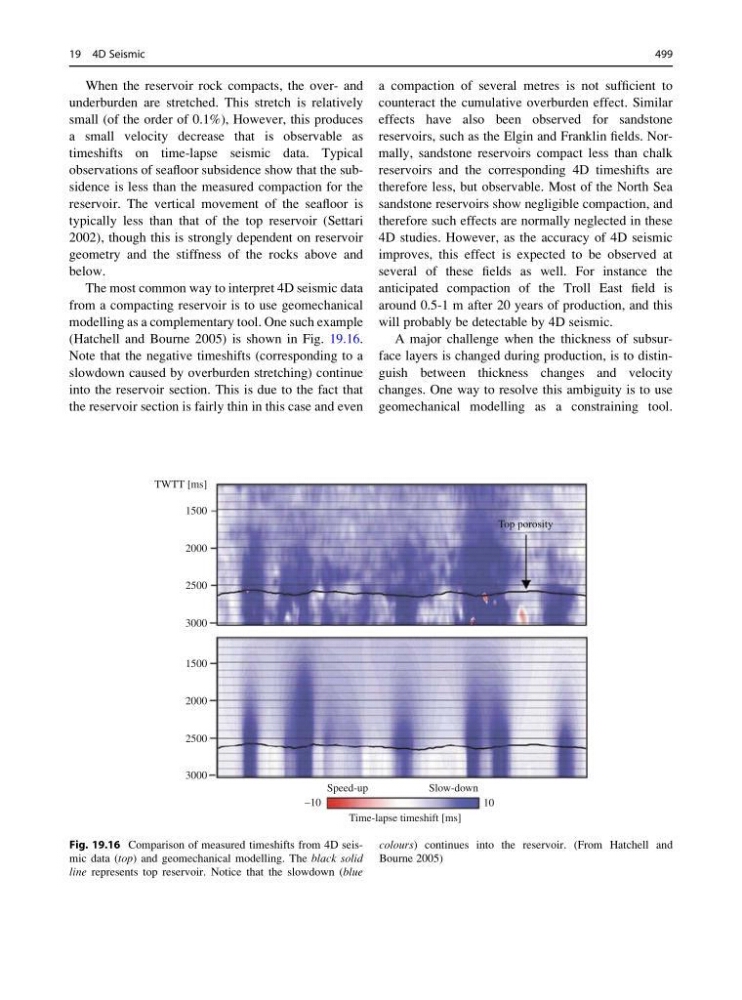
modelling as a complementary tool. One such example
(Hatchell and Bourne 2005) is shown in Fig. 19.16.
Note that the negative timeshifts (corresponding to a
slowdown caused by overburden stretching) continue
into the reservoir section. This is due to the fact that
the reservoir section is fairly thin in this case and even
a compaction of several metres is not sufficient to
counteract the cumulative overburden effect. Similar
effects have also been observed for sandstone
reservoirs, such as the Elgin and Franklin fields. Normally, sandstone reservoirs compact less than chalk
reservoirs and the corresponding 4D timeshifts are
therefore less, but observable. Most of the North Sea
sandstone reservoirs show negligible compaction, and
therefore such effects are normally neglected in these
4D studies. However, as the accuracy of 4D seismic
improves, this effect is expected to be observed at
several of these fields as well. For instance the
anticipated compaction of the Troll East field is
around 0.5-1 m after 20 years of production, and this
will probably be detectable by 4D seismic.
A major challenge when the thickness of subsurface layers is changed during production, is to distinguish between thickness changes and velocity
changes. One way to resolve this ambiguity is to use
geomechanical modelling as a constraining tool.
TWTT [ms]
1500
Top porosity
2000
2500
3000
1500
2000
2500
3000
Speed-up
–10
10
Time-lapse timeshift [ms]
Slow-down
Fig. 19.16 Comparison of measured timeshifts from 4D seismic data (top) and geomechanical modelling. The black solid
line represents top reservoir. Notice that the slowdown (blue
colours) continues into the reservoir. (From Hatchell and
Bourne 2005)
19 4D Seismic
499
underburden are stretched. This stretch is relatively
small (of the order of 0.1%), However, this produces
a small velocity decrease that is observable as
timeshifts on time-lapse seismic data. Typical
observations of seafloor subsidence show that the subsidence is less than the measured compaction for the
reservoir. The vertical movement of the seafloor is
typically less than that of the top reservoir (Settari
2002), though this is strongly dependent on reservoir
geometry and the stiffness of the rocks above and
below.
The most common way to interpret 4D seismic data
from a compacting reservoir is to use geomechanical
modelling as a complementary tool. One such example
(Hatchell and Bourne 2005) is shown in Fig. 19.16.
Note that the negative timeshifts (corresponding to a
slowdown caused by overburden stretching) continue
into the reservoir section. This is due to the fact that
the reservoir section is fairly thin in this case and even
a compaction of several metres is not sufficient to
counteract the cumulative overburden effect. Similar
effects have also been observed for sandstone
reservoirs, such as the Elgin and Franklin fields. Normally, sandstone reservoirs compact less than chalk
reservoirs and the corresponding 4D timeshifts are
therefore less, but observable. Most of the North Sea
sandstone reservoirs show negligible compaction, and
therefore such effects are normally neglected in these
4D studies. However, as the accuracy of 4D seismic
improves, this effect is expected to be observed at
several of these fields as well. For instance the
anticipated compaction of the Troll East field is
around 0.5-1 m after 20 years of production, and this
will probably be detectable by 4D seismic.
A major challenge when the thickness of subsurface layers is changed during production, is to distinguish between thickness changes and velocity
changes. One way to resolve this ambiguity is to use
geomechanical modelling as a constraining tool.
TWTT [ms]
1500
Top porosity
2000
2500
3000
1500
2000
2500
3000
Speed-up
–10
10
Time-lapse timeshift [ms]
Slow-down
Fig. 19.16 Comparison of measured timeshifts from 4D seismic data (top) and geomechanical modelling. The black solid
line represents top reservoir. Notice that the slowdown (blue
colours) continues into the reservoir. (From Hatchell and
Bourne 2005)
19 4D Seismic
499