

Disregarding the weather conditions (the only way
to “control” weather is to wait), most of the items
listed are influenced by acquisition planning and performance. A common way to quantify repeatability is
to use the normalised RMS (root-mean-square)-level,
that is:
NRMS ¼ 2
RMSðmonitor À baseÞ
RMSðmonitorÞ þ RMSðbaseÞ
; (19.8)
where the RMS-levels of the monitor and base traces
are measured within a given time window. Normally,
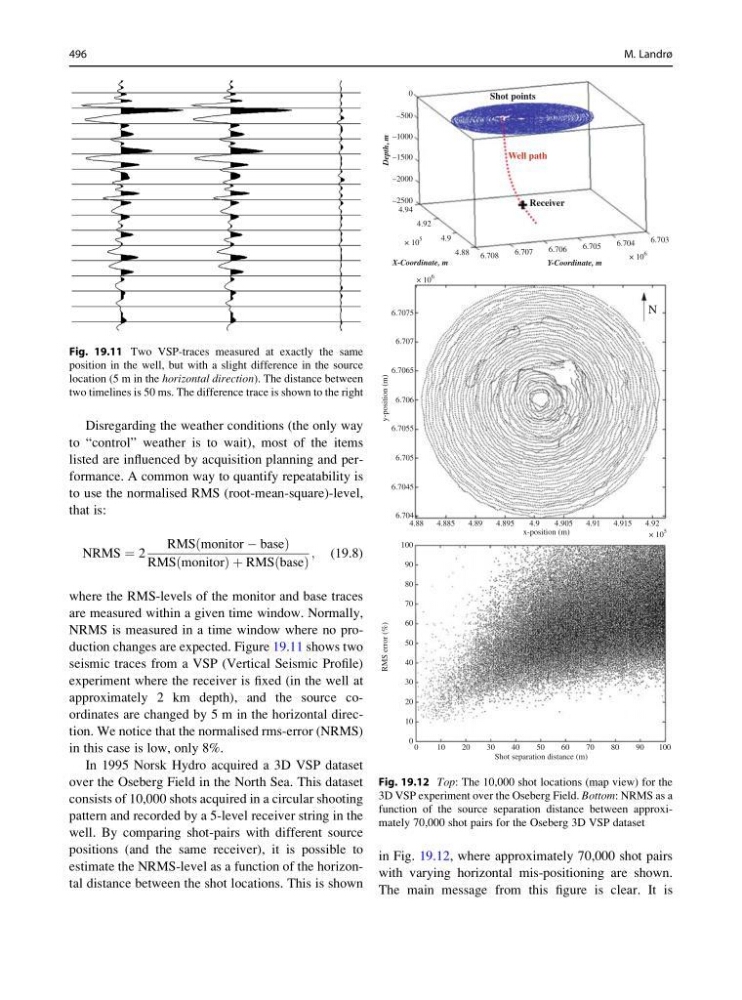
NRMS is measured in a time window where no production changes are expected. Figure 19.11 shows two
seismic traces from a VSP (Vertical Seismic Profile)
experiment where the receiver is fixed (in the well at
approximately 2 km depth), and the source coordinates are changed by 5 m in the horizontal direction. We notice that the normalised rms-error (NRMS)
in this case is low, only 8%.
In 1995 Norsk Hydro acquired a 3D VSP dataset
over the Oseberg Field in the North Sea. This dataset
consists of 10,000 shots acquired in a circular shooting
pattern and recorded by a 5-level receiver string in the
well. By comparing shot-pairs with different source
positions (and the same receiver), it is possible to
estimate the NRMS-level as a function of the horizontal distance between the shot locations. This is shown
in Fig. 19.12, where approximately 70,000 shot pairs
with varying horizontal mis-positioning are shown.
The main message from this figure is clear. It is
Fig. 19.11 Two VSP-traces measured at exactly the same
position in the well, but with a slight difference in the source
location (5 m in the horizontal direction). The distance between
two timelines is 50 ms. The difference trace is shown to the right
0
–500
Shot points
Receiver
Well path
–1000
Depth, m
–1500
–2000
–2500
4.94
4.92
4.9
6.7075
6.707
6.7065
6.706
y-position (m)
6.7055
6.705
6.7045
6.704
100
90
80
70
60
RMS error (%)
50
40
30
20
10
0
0
1 0
2 0
3 0
4 0
5 0
Shot separation distance (m)
60
70
80
90
100
4.88
4.885
4.89
4.895
4.9
4.905
x-position (m)
4.91
4.915
4.92
4.88 6.708
6.707
6.706
6.705
Y-Coordinate, m
X-Coordinate, m
6.704
6.703
N
× 10
6
× 10
5
× 10
5
× 10
6
Fig. 19.12 Top: The 10,000 shot locations (map view) for the
3D VSP experiment over the Oseberg Field. Bottom: NRMS as a
function of the source separation distance between approximately 70,000 shot pairs for the Oseberg 3D VSP dataset
496
M. Landrø
to “control” weather is to wait), most of the items
listed are influenced by acquisition planning and performance. A common way to quantify repeatability is
to use the normalised RMS (root-mean-square)-level,
that is:
NRMS ¼ 2
RMSðmonitor À baseÞ
RMSðmonitorÞ þ RMSðbaseÞ
; (19.8)
where the RMS-levels of the monitor and base traces
are measured within a given time window. Normally,
NRMS is measured in a time window where no production changes are expected. Figure 19.11 shows two
seismic traces from a VSP (Vertical Seismic Profile)
experiment where the receiver is fixed (in the well at
approximately 2 km depth), and the source coordinates are changed by 5 m in the horizontal direction. We notice that the normalised rms-error (NRMS)
in this case is low, only 8%.
In 1995 Norsk Hydro acquired a 3D VSP dataset
over the Oseberg Field in the North Sea. This dataset
consists of 10,000 shots acquired in a circular shooting
pattern and recorded by a 5-level receiver string in the
well. By comparing shot-pairs with different source
positions (and the same receiver), it is possible to
estimate the NRMS-level as a function of the horizontal distance between the shot locations. This is shown
in Fig. 19.12, where approximately 70,000 shot pairs
with varying horizontal mis-positioning are shown.
The main message from this figure is clear. It is
Fig. 19.11 Two VSP-traces measured at exactly the same
position in the well, but with a slight difference in the source
location (5 m in the horizontal direction). The distance between
two timelines is 50 ms. The difference trace is shown to the right
0
–500
Shot points
Receiver
Well path
–1000
Depth, m
–1500
–2000
–2500
4.94
4.92
4.9
6.7075
6.707
6.7065
6.706
y-position (m)
6.7055
6.705
6.7045
6.704
100
90
80
70
60
RMS error (%)
50
40
30
20
10
0
0
1 0
2 0
3 0
4 0
5 0
Shot separation distance (m)
60
70
80
90
100
4.88
4.885
4.89
4.895
4.9
4.905
x-position (m)
4.91
4.915
4.92
4.88 6.708
6.707
6.706
6.705
Y-Coordinate, m
X-Coordinate, m
6.704
6.703
N
× 10
6
× 10
5
× 10
5
× 10
6
Fig. 19.12 Top: The 10,000 shot locations (map view) for the
3D VSP experiment over the Oseberg Field. Bottom: NRMS as a
function of the source separation distance between approximately 70,000 shot pairs for the Oseberg 3D VSP dataset
496
M. Landrø