

repeatability of the seismic data, i.e. how accurately
we can repeat the seismic measurements. This acquisition repeatability is dependent on a number of
factors such as:
• Varying source and receiver positions (x, y and z
co-ordinates)
• Changing weather conditions during acquisition
• Varying seawater temperature
• Tidal effects
• Noise from other vessels or other activity in the
area (rig noise)
• Varying source signal
• Changes in the acquisition system (new vessel,
other cables, sources etc.)
• Variation in shot-generated noise (from previous
shot).
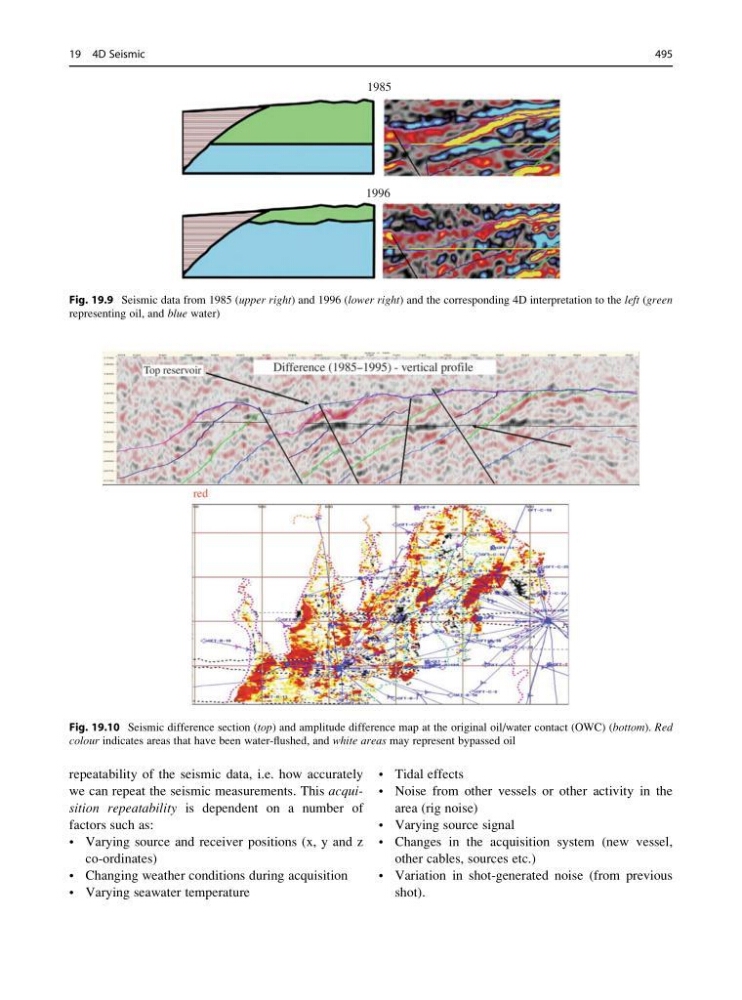
1985
1996
Fig. 19.9 Seismic data from 1985 (upper right) and 1996 (lower right) and the corresponding 4D interpretation to the left (green
representing oil, and blue water)
Fig. 19.10 Seismic difference section (top) and amplitude difference map at the original oil/water contact (OWC) (bottom). Red
colour indicates areas that have been water-flushed, and white areas may represent bypassed oil
19 4D Seismic
495
we can repeat the seismic measurements. This acquisition repeatability is dependent on a number of
factors such as:
• Varying source and receiver positions (x, y and z
co-ordinates)
• Changing weather conditions during acquisition
• Varying seawater temperature
• Tidal effects
• Noise from other vessels or other activity in the
area (rig noise)
• Varying source signal
• Changes in the acquisition system (new vessel,
other cables, sources etc.)
• Variation in shot-generated noise (from previous
shot).
1985
1996
Fig. 19.9 Seismic data from 1985 (upper right) and 1996 (lower right) and the corresponding 4D interpretation to the left (green
representing oil, and blue water)
Fig. 19.10 Seismic difference section (top) and amplitude difference map at the original oil/water contact (OWC) (bottom). Red
colour indicates areas that have been water-flushed, and white areas may represent bypassed oil
19 4D Seismic
495