

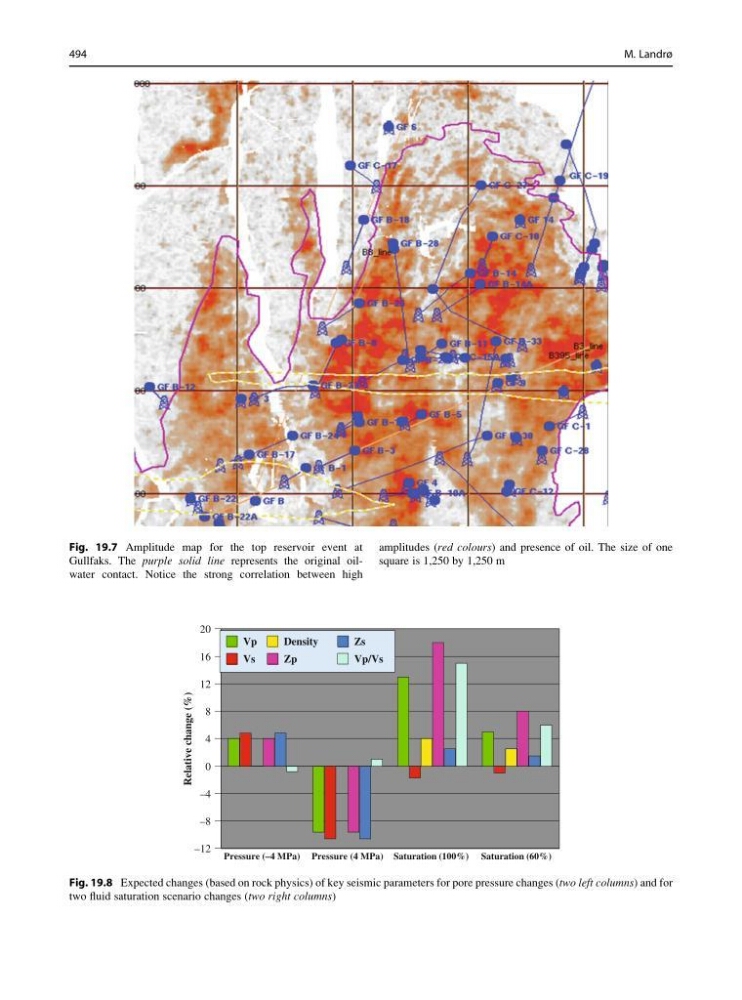
Fig. 19.7 Amplitude map for the top reservoir event at
Gullfaks. The purple solid line represents the original oilwater contact. Notice the strong correlation between high
amplitudes (red colours) and presence of oil. The size of one
square is 1,250 by 1,250 m
Pressure (–4 MPa) Pressure (4 MPa) Saturation (100%) Saturation (60%)
–12
–8
–4
0
4
8
12
16
20
Relative change (%)
Vp
Vs
Density
Zp
Zs
Vp/Vs
Fig. 19.8 Expected changes (based on rock physics) of key seismic parameters for pore pressure changes (two left columns) and for
two fluid saturation scenario changes (two right columns)
494
M. Landrø
Gullfaks. The purple solid line represents the original oilwater contact. Notice the strong correlation between high
amplitudes (red colours) and presence of oil. The size of one
square is 1,250 by 1,250 m
Pressure (–4 MPa) Pressure (4 MPa) Saturation (100%) Saturation (60%)
–12
–8
–4
0
4
8
12
16
20
Relative change (%)
Vp
Vs
Density
Zp
Zs
Vp/Vs
Fig. 19.8 Expected changes (based on rock physics) of key seismic parameters for pore pressure changes (two left columns) and for
two fluid saturation scenario changes (two right columns)
494
M. Landrø