

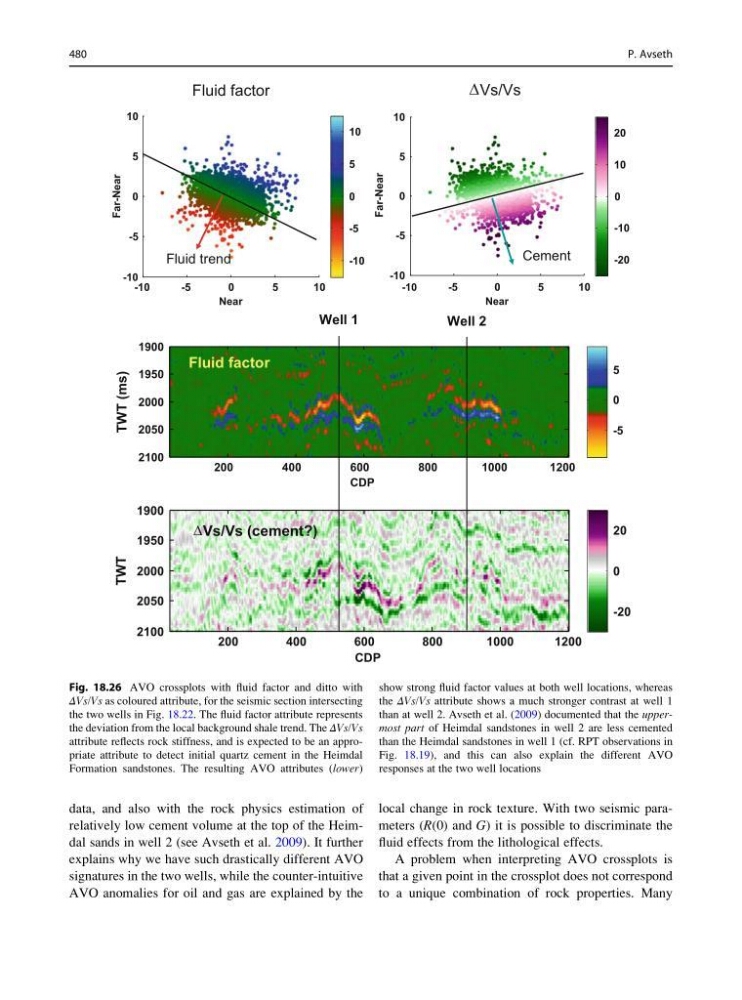
data, and also with the rock physics estimation of
relatively low cement volume at the top of the Heimdal sands in well 2 (see Avseth et al. 2009). It further
explains why we have such drastically different AVO
signatures in the two wells, while the counter-intuitive
AVO anomalies for oil and gas are explained by the
local change in rock texture. With two seismic parameters (R(0) and G) it is possible to discriminate the
fluid effects from the lithological effects.
A problem when interpreting AVO crossplots is
that a given point in the crossplot does not correspond
to a unique combination of rock properties. Many
-10
-5
0
5
10
-10
-5
0
5
10
Near
Far-Near
-10
-5
0
5
10
Fluid factor
-10
-5
0
5
10
-10
-5
0
5
10
Near
Far-Near
-20
-10
0
10
20
Fluid trend
Cement
CDP
TWT
200
400
600
800
1000
1200
1900
1950
2000
2050
2100
-20
0
20
Vs/Vs (cement?)
CDP
TWT (ms)
200
400
600
800
1000
1200
1900
1950
2000
2050
2100
-5
0
5
Fluid factor
Well 1
Well 2
Vs/Vs
D
D
Fig. 18.26 AVO crossplots with fluid factor and ditto with
ΔVs/Vs as coloured attribute, for the seismic section intersecting
the two wells in Fig. 18.22. The fluid factor attribute represents
the deviation from the local background shale trend. The ΔVs/Vs
attribute reflects rock stiffness, and is expected to be an appropriate attribute to detect initial quartz cement in the Heimdal
Formation sandstones. The resulting AVO attributes (lower)
show strong fluid factor values at both well locations, whereas
the ΔVs/Vs attribute shows a much stronger contrast at well 1
than at well 2. Avseth et al. (2009) documented that the uppermost part of Heimdal sandstones in well 2 are less cemented
than the Heimdal sandstones in well 1 (cf. RPT observations in
Fig. 18.19), and this can also explain the different AVO
responses at the two well locations
480
P. Avseth
relatively low cement volume at the top of the Heimdal sands in well 2 (see Avseth et al. 2009). It further
explains why we have such drastically different AVO
signatures in the two wells, while the counter-intuitive
AVO anomalies for oil and gas are explained by the
local change in rock texture. With two seismic parameters (R(0) and G) it is possible to discriminate the
fluid effects from the lithological effects.
A problem when interpreting AVO crossplots is
that a given point in the crossplot does not correspond
to a unique combination of rock properties. Many
-10
-5
0
5
10
-10
-5
0
5
10
Near
Far-Near
-10
-5
0
5
10
Fluid factor
-10
-5
0
5
10
-10
-5
0
5
10
Near
Far-Near
-20
-10
0
10
20
Fluid trend
Cement
CDP
TWT
200
400
600
800
1000
1200
1900
1950
2000
2050
2100
-20
0
20
Vs/Vs (cement?)
CDP
TWT (ms)
200
400
600
800
1000
1200
1900
1950
2000
2050
2100
-5
0
5
Fluid factor
Well 1
Well 2
Vs/Vs
D
D
Fig. 18.26 AVO crossplots with fluid factor and ditto with
ΔVs/Vs as coloured attribute, for the seismic section intersecting
the two wells in Fig. 18.22. The fluid factor attribute represents
the deviation from the local background shale trend. The ΔVs/Vs
attribute reflects rock stiffness, and is expected to be an appropriate attribute to detect initial quartz cement in the Heimdal
Formation sandstones. The resulting AVO attributes (lower)
show strong fluid factor values at both well locations, whereas
the ΔVs/Vs attribute shows a much stronger contrast at well 1
than at well 2. Avseth et al. (2009) documented that the uppermost part of Heimdal sandstones in well 2 are less cemented
than the Heimdal sandstones in well 1 (cf. RPT observations in
Fig. 18.19), and this can also explain the different AVO
responses at the two well locations
480
P. Avseth