

the 4th quadrant is where R(0) is positive and G is
negative (lower right quadrant). The AVO classes
must not be confused with the quadrant numbers.
Class I plots in the 4th quadrant with positive R(0)
and negative gradients. These represent hard events
with relatively high impedance and low Vp/Vs ratio
compared to the cap-rock. Class II represents sands
with weak intercept, but strong negative gradient.
These can be hard to see on the seismic, because
they often yield dim-spots on stacked sections. Class
III is the AVO category that is normally associated
with bright spots. These plot in the 3rd quadrant in
R(0)-G crossplots, and are associated with soft sands
saturated with hydrocarbons.
Ross and Kinman (1995) separated between a class
IIp and class II anomaly. Class IIp has a weak, but
positive intercept and a negative gradient, causing a
polarity change with offset. This class will disappear
on full stack sections. Class II has a weak, but negative
intercept and negative gradient, hence no polarity
change. This class may be observed as a negative
amplitude on a full offset stack.
Castagna and Swan (1997) extended the classification scheme of Rutherford and Williams to include a
4th class, plotting in the 2nd quadrant. These are
relatively rare, but occur when soft sands with gas
are capped by relatively stiff cap-rock shales characterized by Vp/Vs ratios slightly higher than in the sands
(i.e. very compacted or silty shales).
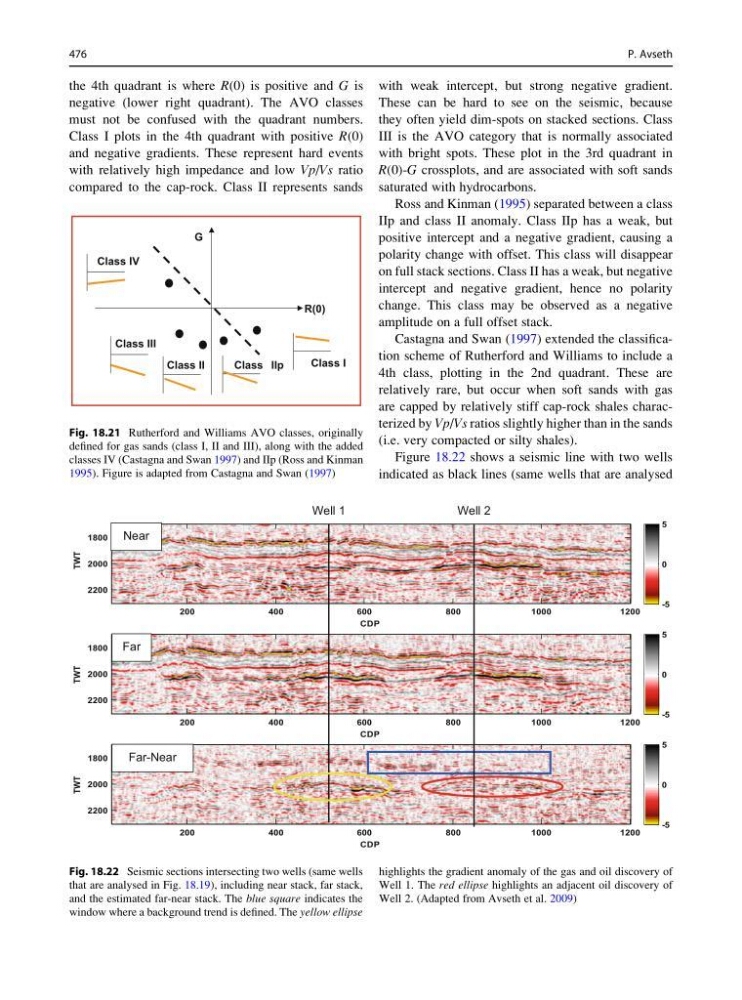
Figure 18.22 shows a seismic line with two wells
indicated as black lines (same wells that are analysed
Class I
Class IIp
Class II
Class III
Class IV
R(0)
G
Fig. 18.21 Rutherford and Williams AVO classes, originally
defined for gas sands (class I, II and III), along with the added
classes IV (Castagna and Swan 1997) and IIp (Ross and Kinman
1995). Figure is adapted from Castagna and Swan (1997)
CDP
TWT
200
400
600
800
1000
1200
1800
2000
2200
CDP
TWT
200
400
600
800
1000
1200
1800
2000
2200
CDP
TWT
200
400
600
800
1000
1200
1800
2000
2200
-5
0
5
-5
0
5
-5
0
5
Well 1
Near
Far
Far-Near
Well 2
Fig. 18.22 Seismic sections intersecting two wells (same wells
that are analysed in Fig. 18.19), including near stack, far stack,
and the estimated far-near stack. The blue square indicates the
window where a background trend is defined. The yellow ellipse
highlights the gradient anomaly of the gas and oil discovery of
Well 1. The red ellipse highlights an adjacent oil discovery of
Well 2. (Adapted from Avseth et al. 2009)
476
P. Avseth
negative (lower right quadrant). The AVO classes
must not be confused with the quadrant numbers.
Class I plots in the 4th quadrant with positive R(0)
and negative gradients. These represent hard events
with relatively high impedance and low Vp/Vs ratio
compared to the cap-rock. Class II represents sands
with weak intercept, but strong negative gradient.
These can be hard to see on the seismic, because
they often yield dim-spots on stacked sections. Class
III is the AVO category that is normally associated
with bright spots. These plot in the 3rd quadrant in
R(0)-G crossplots, and are associated with soft sands
saturated with hydrocarbons.
Ross and Kinman (1995) separated between a class
IIp and class II anomaly. Class IIp has a weak, but
positive intercept and a negative gradient, causing a
polarity change with offset. This class will disappear
on full stack sections. Class II has a weak, but negative
intercept and negative gradient, hence no polarity
change. This class may be observed as a negative
amplitude on a full offset stack.
Castagna and Swan (1997) extended the classification scheme of Rutherford and Williams to include a
4th class, plotting in the 2nd quadrant. These are
relatively rare, but occur when soft sands with gas
are capped by relatively stiff cap-rock shales characterized by Vp/Vs ratios slightly higher than in the sands
(i.e. very compacted or silty shales).
Figure 18.22 shows a seismic line with two wells
indicated as black lines (same wells that are analysed
Class I
Class IIp
Class II
Class III
Class IV
R(0)
G
Fig. 18.21 Rutherford and Williams AVO classes, originally
defined for gas sands (class I, II and III), along with the added
classes IV (Castagna and Swan 1997) and IIp (Ross and Kinman
1995). Figure is adapted from Castagna and Swan (1997)
CDP
TWT
200
400
600
800
1000
1200
1800
2000
2200
CDP
TWT
200
400
600
800
1000
1200
1800
2000
2200
CDP
TWT
200
400
600
800
1000
1200
1800
2000
2200
-5
0
5
-5
0
5
-5
0
5
Well 1
Near
Far
Far-Near
Well 2
Fig. 18.22 Seismic sections intersecting two wells (same wells
that are analysed in Fig. 18.19), including near stack, far stack,
and the estimated far-near stack. The blue square indicates the
window where a background trend is defined. The yellow ellipse
highlights the gradient anomaly of the gas and oil discovery of
Well 1. The red ellipse highlights an adjacent oil discovery of
Well 2. (Adapted from Avseth et al. 2009)
476
P. Avseth