

However, oil reference density is more uncertain.
Also, the seismic response of oil can be difficult to
distinguish from that of brine. One should, however,
expect oil to show values similar to low gas saturation
in AI versus Vp/Vs ratio crossplots. Regarding saturation distribution, we have assumed uniform distribution in the template modelling (Ødegaard and Avseth
2004), which gives the famous effect where residual
amounts of gas will produce almost the same seismic
properties as commercial amounts of gas. However, a
patchy distribution of gas would have shown a more
linear change in seismic properties with increasing gas
saturation (cf. Fig. 18.17).
Pore fluid sensitivity in reservoir sandstones is
highly affected by reservoir heterogeneity and sandstone microstructure, and it is therefore important to
include these geological factors in the rock physics
analysis. As already indicated, initial cement reduces
the pressure and fluid sensitivity of the sandstones.
Figure 18.18 shows schematically the outline of a
rock physics template, where calibrated rock physics
models have been selected that fit local data observations (well log data or seismic inversion data) of various lithologies and pore fluids. The presence of
diagenetic quartz cement will move brine-saturated
sandstone data in an AI versus Vp/Vs crossplot to an
area of very low Vp/Vs, where we would expect hydrocarbon-saturated sandstones to plot. By contrast, reservoir heterogeneity and decreasing net-to-gross
associated with interbedded sands and shales tend to
move data points in the direction of the shale cluster.
The cement effect is a microstructural effect, whereas
the net-to-gross is related to the scale of shale/sand
interbedding and is frequency dependent. In the case
where the interbedded shale is relatively soft compared to the sand, the net-to-gross effect will counteract the effect of cement on effective rock stiffness,
hence these two effects will have opposite trends in the
AI-Vp/Vs crossplot. The schematic, but qualitatively
correct illustration in Fig. 18.18 demonstrates why it is
important to include these geological factors when
analysing the rock physics properties and seismic
fluid sensitivity in reservoir sandstones.
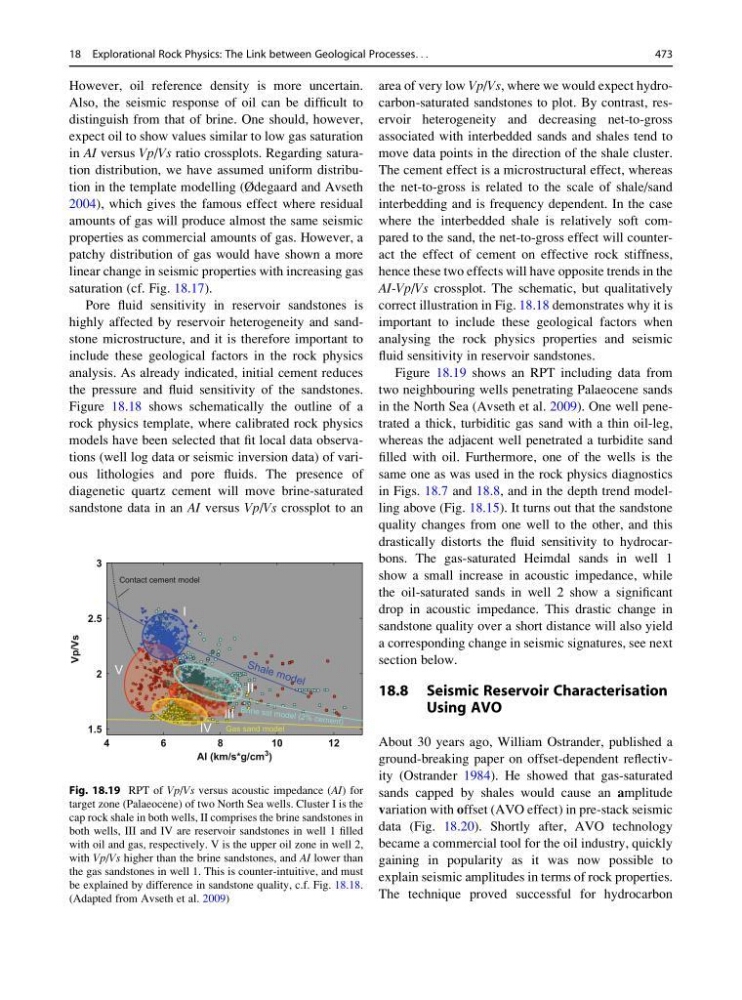
Figure 18.19 shows an RPT including data from
two neighbouring wells penetrating Palaeocene sands
in the North Sea (Avseth et al. 2009). One well penetrated a thick, turbiditic gas sand with a thin oil-leg,
whereas the adjacent well penetrated a turbidite sand
filled with oil. Furthermore, one of the wells is the
same one as was used in the rock physics diagnostics
in Figs. 18.7 and 18.8, and in the depth trend modelling above (Fig. 18.15). It turns out that the sandstone
quality changes from one well to the other, and this
drastically distorts the fluid sensitivity to hydrocarbons. The gas-saturated Heimdal sands in well 1
show a small increase in acoustic impedance, while
the oil-saturated sands in well 2 show a significant
drop in acoustic impedance. This drastic change in
sandstone quality over a short distance will also yield
a corresponding change in seismic signatures, see next
section below.
18.8 Seismic Reservoir Characterisation
Using AVO
About 30 years ago, William Ostrander, published a
ground-breaking paper on offset-dependent reflectivity (Ostrander 1984). He showed that gas-saturated
sands capped by shales would cause an amplitude
variation with offset (AVO effect) in pre-stack seismic
data (Fig. 18.20). Shortly after, AVO technology
became a commercial tool for the oil industry, quickly
gaining in popularity as it was now possible to
explain seismic amplitudes in terms of rock properties.
The technique proved successful for hydrocarbon
4
6
8
10
12
1.5
2
2.5
3
AI (km/s*g/cm
3 )
Vp/Vs
V
III
I
II
IV Gas sand model
Brin e sst mod el (2% cem ent )
S h a le m o d e l
Contact cement model
Fig. 18.19 RPT of Vp/Vs versus acoustic impedance (AI) for
target zone (Palaeocene) of two North Sea wells. Cluster I is the
cap rock shale in both wells, II comprises the brine sandstones in
both wells, III and IV are reservoir sandstones in well 1 filled
with oil and gas, respectively. V is the upper oil zone in well 2,
with Vp/Vs higher than the brine sandstones, and AI lower than
the gas sandstones in well 1. This is counter-intuitive, and must
be explained by difference in sandstone quality, c.f. Fig. 18.18.
(Adapted from Avseth et al. 2009)
18 Explorational Rock Physics: The Link between Geological Processes. . .
473
Also, the seismic response of oil can be difficult to
distinguish from that of brine. One should, however,
expect oil to show values similar to low gas saturation
in AI versus Vp/Vs ratio crossplots. Regarding saturation distribution, we have assumed uniform distribution in the template modelling (Ødegaard and Avseth
2004), which gives the famous effect where residual
amounts of gas will produce almost the same seismic
properties as commercial amounts of gas. However, a
patchy distribution of gas would have shown a more
linear change in seismic properties with increasing gas
saturation (cf. Fig. 18.17).
Pore fluid sensitivity in reservoir sandstones is
highly affected by reservoir heterogeneity and sandstone microstructure, and it is therefore important to
include these geological factors in the rock physics
analysis. As already indicated, initial cement reduces
the pressure and fluid sensitivity of the sandstones.
Figure 18.18 shows schematically the outline of a
rock physics template, where calibrated rock physics
models have been selected that fit local data observations (well log data or seismic inversion data) of various lithologies and pore fluids. The presence of
diagenetic quartz cement will move brine-saturated
sandstone data in an AI versus Vp/Vs crossplot to an
area of very low Vp/Vs, where we would expect hydrocarbon-saturated sandstones to plot. By contrast, reservoir heterogeneity and decreasing net-to-gross
associated with interbedded sands and shales tend to
move data points in the direction of the shale cluster.
The cement effect is a microstructural effect, whereas
the net-to-gross is related to the scale of shale/sand
interbedding and is frequency dependent. In the case
where the interbedded shale is relatively soft compared to the sand, the net-to-gross effect will counteract the effect of cement on effective rock stiffness,
hence these two effects will have opposite trends in the
AI-Vp/Vs crossplot. The schematic, but qualitatively
correct illustration in Fig. 18.18 demonstrates why it is
important to include these geological factors when
analysing the rock physics properties and seismic
fluid sensitivity in reservoir sandstones.
Figure 18.19 shows an RPT including data from
two neighbouring wells penetrating Palaeocene sands
in the North Sea (Avseth et al. 2009). One well penetrated a thick, turbiditic gas sand with a thin oil-leg,
whereas the adjacent well penetrated a turbidite sand
filled with oil. Furthermore, one of the wells is the
same one as was used in the rock physics diagnostics
in Figs. 18.7 and 18.8, and in the depth trend modelling above (Fig. 18.15). It turns out that the sandstone
quality changes from one well to the other, and this
drastically distorts the fluid sensitivity to hydrocarbons. The gas-saturated Heimdal sands in well 1
show a small increase in acoustic impedance, while
the oil-saturated sands in well 2 show a significant
drop in acoustic impedance. This drastic change in
sandstone quality over a short distance will also yield
a corresponding change in seismic signatures, see next
section below.
18.8 Seismic Reservoir Characterisation
Using AVO
About 30 years ago, William Ostrander, published a
ground-breaking paper on offset-dependent reflectivity (Ostrander 1984). He showed that gas-saturated
sands capped by shales would cause an amplitude
variation with offset (AVO effect) in pre-stack seismic
data (Fig. 18.20). Shortly after, AVO technology
became a commercial tool for the oil industry, quickly
gaining in popularity as it was now possible to
explain seismic amplitudes in terms of rock properties.
The technique proved successful for hydrocarbon
4
6
8
10
12
1.5
2
2.5
3
AI (km/s*g/cm
3 )
Vp/Vs
V
III
I
II
IV Gas sand model
Brin e sst mod el (2% cem ent )
S h a le m o d e l
Contact cement model
Fig. 18.19 RPT of Vp/Vs versus acoustic impedance (AI) for
target zone (Palaeocene) of two North Sea wells. Cluster I is the
cap rock shale in both wells, II comprises the brine sandstones in
both wells, III and IV are reservoir sandstones in well 1 filled
with oil and gas, respectively. V is the upper oil zone in well 2,
with Vp/Vs higher than the brine sandstones, and AI lower than
the gas sandstones in well 1. This is counter-intuitive, and must
be explained by difference in sandstone quality, c.f. Fig. 18.18.
(Adapted from Avseth et al. 2009)
18 Explorational Rock Physics: The Link between Geological Processes. . .
473