

Sea (i.e. within the Balder Formation). Smectite is
often generated from the alteration of volcanic tuff,
but tuff also includes amorphous silica that can precipitate as quartz cement even at temperatures below
70
C. Amorphous silica is thus able to dissolve at
lower temperatures than crystalline quartz.
There are also potential internal sources of quartz
cement in the sandstones, either from authigenic or
detrital clays in the sandstone matrix, or from the
quartz grains themselves. Moreover, it has been confirmed that clay minerals can both inhibit the precipitation, and catalyse the dissolution, of quartz in
sandstones. The presence of oil has also been shown
to inhibit quartz cementation in oil-wetting sandstones
(e.g. Giles et al. 2000). There is considerable debate
among geologists over whether effective pressure at
quartz grain contacts in sandstones can cause quartz
dissolution and re-precipitation around the grain contacts. More likely, time and temperature control the
quartz cementation (e.g. Bjørlykke and Egeberg 1993).
Regardless of the complexity of the clay and quartz
diagenesis, there is empirical evidence that both the
smectite to illite transformation in shales and the
quartz cementation of sandstones are geochemical
processes that tend to initiate concurrently at around
70–80
C. In the North Sea, this corresponds to a burial
depth of about 2 km which is around the target depth
of the prolific Palaeocene and Eocene reservoir sands
that represent major prospects for the oil industry.
Geophysicists should be focused on these geological
factors during seismic data analysis of reservoir sands,
because dramatic changes in the seismic signatures
may reflect not pore fluid changes, but diagenetic
alterations in the cap-rock shales and/or reservoir
sandstones.
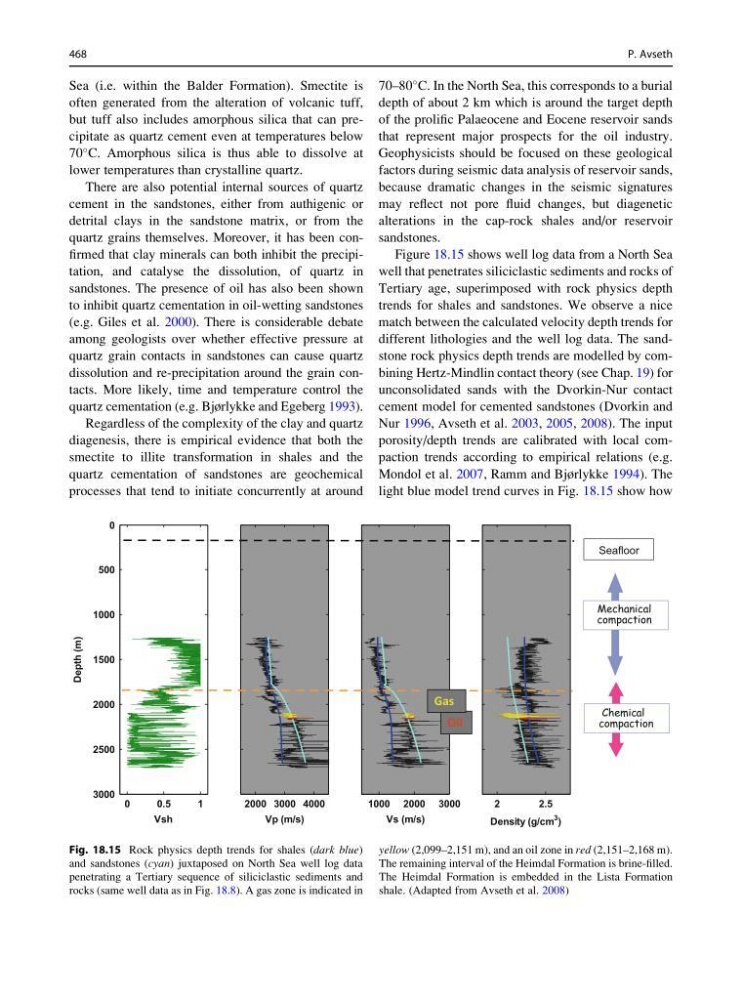
Figure 18.15 shows well log data from a North Sea
well that penetrates siliciclastic sediments and rocks of
Tertiary age, superimposed with rock physics depth
trends for shales and sandstones. We observe a nice
match between the calculated velocity depth trends for
different lithologies and the well log data. The sandstone rock physics depth trends are modelled by combining Hertz-Mindlin contact theory (see Chap. 19) for
unconsolidated sands with the Dvorkin-Nur contact
cement model for cemented sandstones (Dvorkin and
Nur 1996, Avseth et al. 2003, 2005, 2008). The input
porosity/depth trends are calibrated with local compaction trends according to empirical relations (e.g.
Mondol et al. 2007, Ramm and Bjørlykke 1994). The
light blue model trend curves in Fig. 18.15 show how
0
0.5
1
0
500
1000
1500
2000
2500
3000
Vsh
Depth (m)
2000 3000 4000
Vp (m/s)
1000 2000 3000
Vs (m/s)
2
2.5
Density (g/cm
3 )
Seafloor
Oil
Gas
Fig. 18.15 Rock physics depth trends for shales (dark blue)
and sandstones (cyan) juxtaposed on North Sea well log data
penetrating a Tertiary sequence of siliciclastic sediments and
rocks (same well data as in Fig. 18.8). A gas zone is indicated in
yellow (2,099–2,151 m), and an oil zone in red (2,151–2,168 m).
The remaining interval of the Heimdal Formation is brine-filled.
The Heimdal Formation is embedded in the Lista Formation
shale. (Adapted from Avseth et al. 2008)
468
P. Avseth
often generated from the alteration of volcanic tuff,
but tuff also includes amorphous silica that can precipitate as quartz cement even at temperatures below
70
C. Amorphous silica is thus able to dissolve at
lower temperatures than crystalline quartz.
There are also potential internal sources of quartz
cement in the sandstones, either from authigenic or
detrital clays in the sandstone matrix, or from the
quartz grains themselves. Moreover, it has been confirmed that clay minerals can both inhibit the precipitation, and catalyse the dissolution, of quartz in
sandstones. The presence of oil has also been shown
to inhibit quartz cementation in oil-wetting sandstones
(e.g. Giles et al. 2000). There is considerable debate
among geologists over whether effective pressure at
quartz grain contacts in sandstones can cause quartz
dissolution and re-precipitation around the grain contacts. More likely, time and temperature control the
quartz cementation (e.g. Bjørlykke and Egeberg 1993).
Regardless of the complexity of the clay and quartz
diagenesis, there is empirical evidence that both the
smectite to illite transformation in shales and the
quartz cementation of sandstones are geochemical
processes that tend to initiate concurrently at around
70–80
C. In the North Sea, this corresponds to a burial
depth of about 2 km which is around the target depth
of the prolific Palaeocene and Eocene reservoir sands
that represent major prospects for the oil industry.
Geophysicists should be focused on these geological
factors during seismic data analysis of reservoir sands,
because dramatic changes in the seismic signatures
may reflect not pore fluid changes, but diagenetic
alterations in the cap-rock shales and/or reservoir
sandstones.
Figure 18.15 shows well log data from a North Sea
well that penetrates siliciclastic sediments and rocks of
Tertiary age, superimposed with rock physics depth
trends for shales and sandstones. We observe a nice
match between the calculated velocity depth trends for
different lithologies and the well log data. The sandstone rock physics depth trends are modelled by combining Hertz-Mindlin contact theory (see Chap. 19) for
unconsolidated sands with the Dvorkin-Nur contact
cement model for cemented sandstones (Dvorkin and
Nur 1996, Avseth et al. 2003, 2005, 2008). The input
porosity/depth trends are calibrated with local compaction trends according to empirical relations (e.g.
Mondol et al. 2007, Ramm and Bjørlykke 1994). The
light blue model trend curves in Fig. 18.15 show how
0
0.5
1
0
500
1000
1500
2000
2500
3000
Vsh
Depth (m)
2000 3000 4000
Vp (m/s)
1000 2000 3000
Vs (m/s)
2
2.5
Density (g/cm
3 )
Seafloor
Oil
Gas
Fig. 18.15 Rock physics depth trends for shales (dark blue)
and sandstones (cyan) juxtaposed on North Sea well log data
penetrating a Tertiary sequence of siliciclastic sediments and
rocks (same well data as in Fig. 18.8). A gas zone is indicated in
yellow (2,099–2,151 m), and an oil zone in red (2,151–2,168 m).
The remaining interval of the Heimdal Formation is brine-filled.
The Heimdal Formation is embedded in the Lista Formation
shale. (Adapted from Avseth et al. 2008)
468
P. Avseth