

sands (Facies IIa), uncemented or friable clean sands
(Facies IIb) and plane-laminated sands (Facies IIc).
Our seismic lithofacies can be linked to depositional
sub-environments and sedimentary processes within a
deepwater clastic system (e.g. Walker 1978, Reading
and Richards 1994).
Avseth et al. (2001a) selected a type-well for identification of seismic lithofacies from well log data
(Fig. 18.12). Primarily, the gamma ray log was used
to determine the different facies, as it is a good clay
indicator in the quartz-rich sediments of the North Sea.
Density and sonic logs were also used to ensure that
each facies occurs as significant clusters in terms of
rock physics properties. Rock physics analysis can
furthermore be used diagnostically to determine lithofacies when direct core and thin-section data are not
available. This was essential in order to confirm the
presence of cement in Facies IIa. The cementation in
Facies IIa is volumetrically not very significant, but in
terms of elastic properties it has an important impact.
The seismic velocities and impedances are relatively
high because of the stiffening effect of initial cementation.
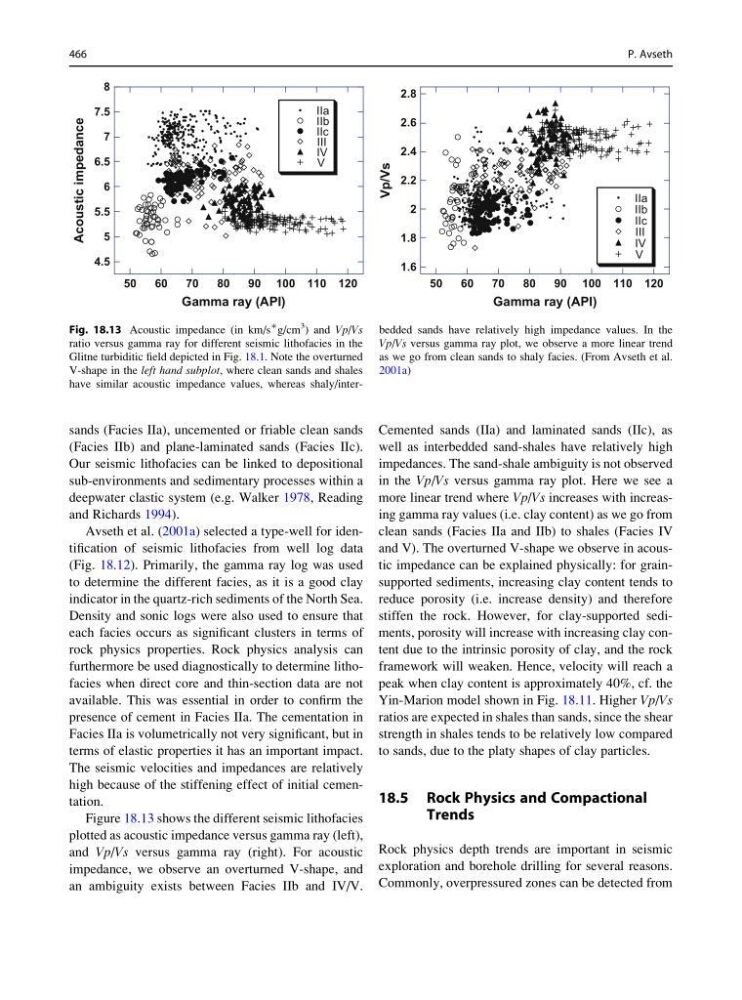
Figure 18.13 shows the different seismic lithofacies
plotted as acoustic impedance versus gamma ray (left),
and Vp/Vs versus gamma ray (right). For acoustic
impedance, we observe an overturned V-shape, and
an ambiguity exists between Facies IIb and IV/V.
Cemented sands (IIa) and laminated sands (IIc), as
well as interbedded sand-shales have relatively high
impedances. The sand-shale ambiguity is not observed
in the Vp/Vs versus gamma ray plot. Here we see a
more linear trend where Vp/Vs increases with increasing gamma ray values (i.e. clay content) as we go from
clean sands (Facies IIa and IIb) to shales (Facies IV
and V). The overturned V-shape we observe in acoustic impedance can be explained physically: for grainsupported sediments, increasing clay content tends to
reduce porosity (i.e. increase density) and therefore
stiffen the rock. However, for clay-supported sediments, porosity will increase with increasing clay content due to the intrinsic porosity of clay, and the rock
framework will weaken. Hence, velocity will reach a
peak when clay content is approximately 40%, cf. the
Yin-Marion model shown in Fig. 18.11. Higher Vp/Vs
ratios are expected in shales than sands, since the shear
strength in shales tends to be relatively low compared
to sands, due to the platy shapes of clay particles.
18.5 Rock Physics and Compactional
Trends
Rock physics depth trends are important in seismic
exploration and borehole drilling for several reasons.
Commonly, overpressured zones can be detected from
50
60
70
80
90 100 110 120
4.5
5
5.5
6
6.5
7
7.5
8
IIa
IIb
IIc
III
IV
V
Gamma ray (API)
Acoustic impedance
50
60
70
80
90 100 110 120
1.6
1.8
2
2.2
2.4
2.6
2.8
IIa
IIb
IIc
III
IV
V
Gamma ray (API)
Vp/Vs
Fig. 18.13 Acoustic impedance (in km/s
∗ g/cm
3
) and Vp/Vs
ratio versus gamma ray for different seismic lithofacies in the
Glitne turbiditic field depicted in Fig. 18.1. Note the overturned
V-shape in the left hand subplot, where clean sands and shales
have similar acoustic impedance values, whereas shaly/interbedded sands have relatively high impedance values. In the
Vp/Vs versus gamma ray plot, we observe a more linear trend
as we go from clean sands to shaly facies. (From Avseth et al.
2001a)
466
P. Avseth
(Facies IIb) and plane-laminated sands (Facies IIc).
Our seismic lithofacies can be linked to depositional
sub-environments and sedimentary processes within a
deepwater clastic system (e.g. Walker 1978, Reading
and Richards 1994).
Avseth et al. (2001a) selected a type-well for identification of seismic lithofacies from well log data
(Fig. 18.12). Primarily, the gamma ray log was used
to determine the different facies, as it is a good clay
indicator in the quartz-rich sediments of the North Sea.
Density and sonic logs were also used to ensure that
each facies occurs as significant clusters in terms of
rock physics properties. Rock physics analysis can
furthermore be used diagnostically to determine lithofacies when direct core and thin-section data are not
available. This was essential in order to confirm the
presence of cement in Facies IIa. The cementation in
Facies IIa is volumetrically not very significant, but in
terms of elastic properties it has an important impact.
The seismic velocities and impedances are relatively
high because of the stiffening effect of initial cementation.
Figure 18.13 shows the different seismic lithofacies
plotted as acoustic impedance versus gamma ray (left),
and Vp/Vs versus gamma ray (right). For acoustic
impedance, we observe an overturned V-shape, and
an ambiguity exists between Facies IIb and IV/V.
Cemented sands (IIa) and laminated sands (IIc), as
well as interbedded sand-shales have relatively high
impedances. The sand-shale ambiguity is not observed
in the Vp/Vs versus gamma ray plot. Here we see a
more linear trend where Vp/Vs increases with increasing gamma ray values (i.e. clay content) as we go from
clean sands (Facies IIa and IIb) to shales (Facies IV
and V). The overturned V-shape we observe in acoustic impedance can be explained physically: for grainsupported sediments, increasing clay content tends to
reduce porosity (i.e. increase density) and therefore
stiffen the rock. However, for clay-supported sediments, porosity will increase with increasing clay content due to the intrinsic porosity of clay, and the rock
framework will weaken. Hence, velocity will reach a
peak when clay content is approximately 40%, cf. the
Yin-Marion model shown in Fig. 18.11. Higher Vp/Vs
ratios are expected in shales than sands, since the shear
strength in shales tends to be relatively low compared
to sands, due to the platy shapes of clay particles.
18.5 Rock Physics and Compactional
Trends
Rock physics depth trends are important in seismic
exploration and borehole drilling for several reasons.
Commonly, overpressured zones can be detected from
50
60
70
80
90 100 110 120
4.5
5
5.5
6
6.5
7
7.5
8
IIa
IIb
IIc
III
IV
V
Gamma ray (API)
Acoustic impedance
50
60
70
80
90 100 110 120
1.6
1.8
2
2.2
2.4
2.6
2.8
IIa
IIb
IIc
III
IV
V
Gamma ray (API)
Vp/Vs
Fig. 18.13 Acoustic impedance (in km/s
∗ g/cm
3
) and Vp/Vs
ratio versus gamma ray for different seismic lithofacies in the
Glitne turbiditic field depicted in Fig. 18.1. Note the overturned
V-shape in the left hand subplot, where clean sands and shales
have similar acoustic impedance values, whereas shaly/interbedded sands have relatively high impedance values. In the
Vp/Vs versus gamma ray plot, we observe a more linear trend
as we go from clean sands to shaly facies. (From Avseth et al.
2001a)
466
P. Avseth