

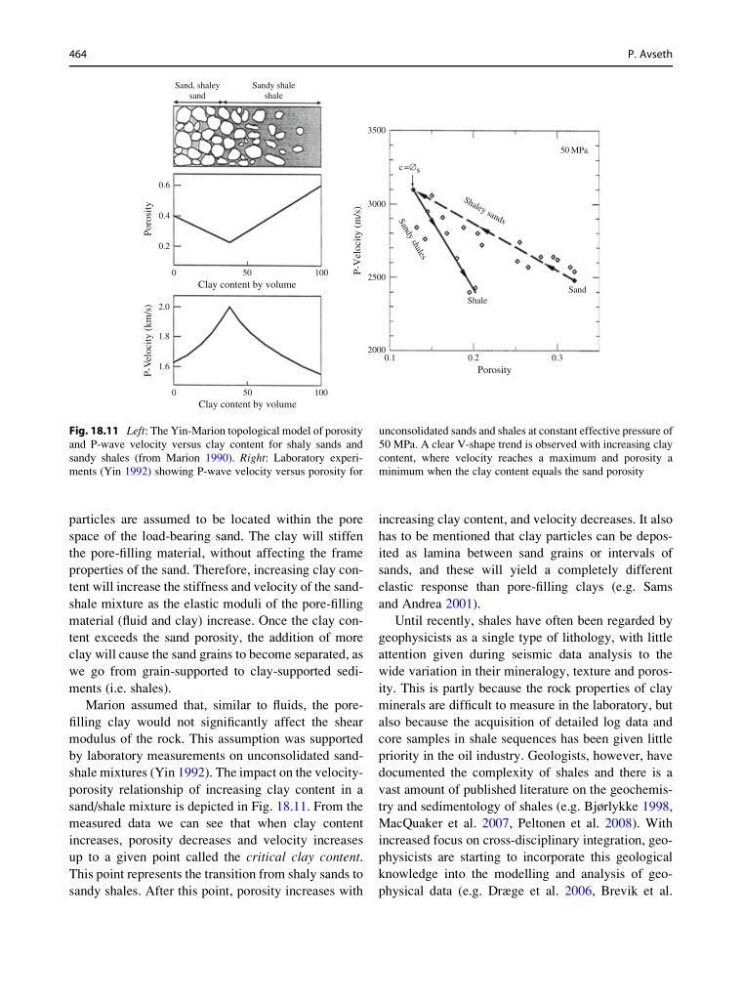
particles are assumed to be located within the pore
space of the load-bearing sand. The clay will stiffen
the pore-filling material, without affecting the frame
properties of the sand. Therefore, increasing clay content will increase the stiffness and velocity of the sandshale mixture as the elastic moduli of the pore-filling
material (fluid and clay) increase. Once the clay content exceeds the sand porosity, the addition of more
clay will cause the sand grains to become separated, as
we go from grain-supported to clay-supported sediments (i.e. shales).
Marion assumed that, similar to fluids, the porefilling clay would not significantly affect the shear
modulus of the rock. This assumption was supported
by laboratory measurements on unconsolidated sandshale mixtures (Yin 1992). The impact on the velocityporosity relationship of increasing clay content in a
sand/shale mixture is depicted in Fig. 18.11. From the
measured data we can see that when clay content
increases, porosity decreases and velocity increases
up to a given point called the critical clay content.
This point represents the transition from shaly sands to
sandy shales. After this point, porosity increases with
increasing clay content, and velocity decreases. It also
has to be mentioned that clay particles can be deposited as lamina between sand grains or intervals of
sands, and these will yield a completely different
elastic response than pore-filling clays (e.g. Sams
and Andrea 2001).
Until recently, shales have often been regarded by
geophysicists as a single type of lithology, with little
attention given during seismic data analysis to the
wide variation in their mineralogy, texture and porosity. This is partly because the rock properties of clay
minerals are difficult to measure in the laboratory, but
also because the acquisition of detailed log data and
core samples in shale sequences has been given little
priority in the oil industry. Geologists, however, have
documented the complexity of shales and there is a
vast amount of published literature on the geochemistry and sedimentology of shales (e.g. Bjørlykke 1998,
MacQuaker et al. 2007, Peltonen et al. 2008). With
increased focus on cross-disciplinary integration, geophysicists are starting to incorporate this geological
knowledge into the modelling and analysis of geophysical data (e.g. Dræge et al. 2006, Brevik et al.
0
1.6
1.8
2.0
50
Clay content by volume
100
0
0.2
0.4
Porosity
P-Velocity (km/s)
P-Velocity (m/s)
0.6
Sand, shaley
sand
Sandy shale
shale
3500
3000
2500
2000
0.1
0.2
0.3
Porosity
Shale
Sand
50 MPa
c =Æ s
S h a le y s a n d s
S a n d y s h a le s
50
Clay content by volume
100
Fig. 18.11 Left: The Yin-Marion topological model of porosity
and P-wave velocity versus clay content for shaly sands and
sandy shales (from Marion 1990). Right: Laboratory experiments (Yin 1992) showing P-wave velocity versus porosity for
unconsolidated sands and shales at constant effective pressure of
50 MPa. A clear V-shape trend is observed with increasing clay
content, where velocity reaches a maximum and porosity a
minimum when the clay content equals the sand porosity
464
P. Avseth
space of the load-bearing sand. The clay will stiffen
the pore-filling material, without affecting the frame
properties of the sand. Therefore, increasing clay content will increase the stiffness and velocity of the sandshale mixture as the elastic moduli of the pore-filling
material (fluid and clay) increase. Once the clay content exceeds the sand porosity, the addition of more
clay will cause the sand grains to become separated, as
we go from grain-supported to clay-supported sediments (i.e. shales).
Marion assumed that, similar to fluids, the porefilling clay would not significantly affect the shear
modulus of the rock. This assumption was supported
by laboratory measurements on unconsolidated sandshale mixtures (Yin 1992). The impact on the velocityporosity relationship of increasing clay content in a
sand/shale mixture is depicted in Fig. 18.11. From the
measured data we can see that when clay content
increases, porosity decreases and velocity increases
up to a given point called the critical clay content.
This point represents the transition from shaly sands to
sandy shales. After this point, porosity increases with
increasing clay content, and velocity decreases. It also
has to be mentioned that clay particles can be deposited as lamina between sand grains or intervals of
sands, and these will yield a completely different
elastic response than pore-filling clays (e.g. Sams
and Andrea 2001).
Until recently, shales have often been regarded by
geophysicists as a single type of lithology, with little
attention given during seismic data analysis to the
wide variation in their mineralogy, texture and porosity. This is partly because the rock properties of clay
minerals are difficult to measure in the laboratory, but
also because the acquisition of detailed log data and
core samples in shale sequences has been given little
priority in the oil industry. Geologists, however, have
documented the complexity of shales and there is a
vast amount of published literature on the geochemistry and sedimentology of shales (e.g. Bjørlykke 1998,
MacQuaker et al. 2007, Peltonen et al. 2008). With
increased focus on cross-disciplinary integration, geophysicists are starting to incorporate this geological
knowledge into the modelling and analysis of geophysical data (e.g. Dræge et al. 2006, Brevik et al.
0
1.6
1.8
2.0
50
Clay content by volume
100
0
0.2
0.4
Porosity
P-Velocity (km/s)
P-Velocity (m/s)
0.6
Sand, shaley
sand
Sandy shale
shale
3500
3000
2500
2000
0.1
0.2
0.3
Porosity
Shale
Sand
50 MPa
c =Æ s
S h a le y s a n d s
S a n d y s h a le s
50
Clay content by volume
100
Fig. 18.11 Left: The Yin-Marion topological model of porosity
and P-wave velocity versus clay content for shaly sands and
sandy shales (from Marion 1990). Right: Laboratory experiments (Yin 1992) showing P-wave velocity versus porosity for
unconsolidated sands and shales at constant effective pressure of
50 MPa. A clear V-shape trend is observed with increasing clay
content, where velocity reaches a maximum and porosity a
minimum when the clay content equals the sand porosity
464
P. Avseth