

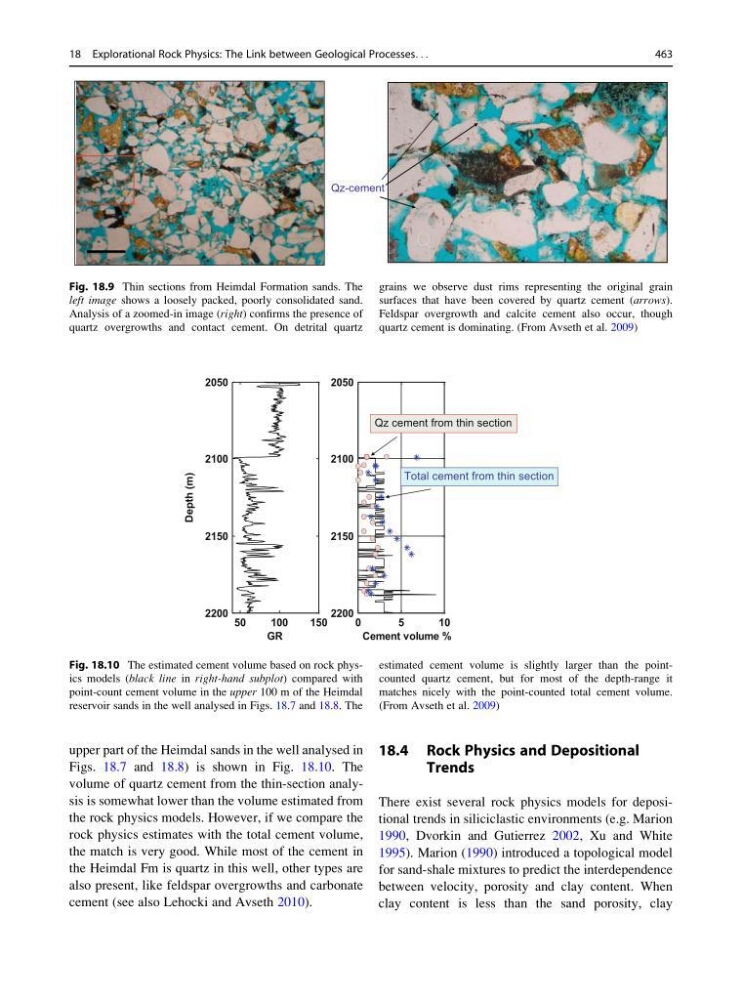
upper part of the Heimdal sands in the well analysed in
Figs. 18.7 and 18.8) is shown in Fig. 18.10. The
volume of quartz cement from the thin-section analysis is somewhat lower than the volume estimated from
the rock physics models. However, if we compare the
rock physics estimates with the total cement volume,
the match is very good. While most of the cement in
the Heimdal Fm is quartz in this well, other types are
also present, like feldspar overgrowths and carbonate
cement (see also Lehocki and Avseth 2010).
18.4 Rock Physics and Depositional
Trends
There exist several rock physics models for depositional trends in siliciclastic environments (e.g. Marion
1990, Dvorkin and Gutierrez 2002, Xu and White
1995). Marion (1990) introduced a topological model
for sand-shale mixtures to predict the interdependence
between velocity, porosity and clay content. When
clay content is less than the sand porosity, clay
Qz-cement
Q
Fig. 18.9 Thin sections from Heimdal Formation sands. The
left image shows a loosely packed, poorly consolidated sand.
Analysis of a zoomed-in image (right) confirms the presence of
quartz overgrowths and contact cement. On detrital quartz
grains we observe dust rims representing the original grain
surfaces that have been covered by quartz cement (arrows).
Feldspar overgrowth and calcite cement also occur, though
quartz cement is dominating. (From Avseth et al. 2009)
50
100
150
2050
2100
2150
2200
GR
Depth (m)
0
5
10
2050
2100
2150
2200
Cement volume %
Qz cement from thin section
Total cement from thin section
Fig. 18.10 The estimated cement volume based on rock physics models (black line in right-hand subplot) compared with
point-count cement volume in the upper 100 m of the Heimdal
reservoir sands in the well analysed in Figs. 18.7 and 18.8. The
estimated cement volume is slightly larger than the pointcounted quartz cement, but for most of the depth-range it
matches nicely with the point-counted total cement volume.
(From Avseth et al. 2009)
18 Explorational Rock Physics: The Link between Geological Processes. . .
463
Figs. 18.7 and 18.8) is shown in Fig. 18.10. The
volume of quartz cement from the thin-section analysis is somewhat lower than the volume estimated from
the rock physics models. However, if we compare the
rock physics estimates with the total cement volume,
the match is very good. While most of the cement in
the Heimdal Fm is quartz in this well, other types are
also present, like feldspar overgrowths and carbonate
cement (see also Lehocki and Avseth 2010).
18.4 Rock Physics and Depositional
Trends
There exist several rock physics models for depositional trends in siliciclastic environments (e.g. Marion
1990, Dvorkin and Gutierrez 2002, Xu and White
1995). Marion (1990) introduced a topological model
for sand-shale mixtures to predict the interdependence
between velocity, porosity and clay content. When
clay content is less than the sand porosity, clay
Qz-cement
Q
Fig. 18.9 Thin sections from Heimdal Formation sands. The
left image shows a loosely packed, poorly consolidated sand.
Analysis of a zoomed-in image (right) confirms the presence of
quartz overgrowths and contact cement. On detrital quartz
grains we observe dust rims representing the original grain
surfaces that have been covered by quartz cement (arrows).
Feldspar overgrowth and calcite cement also occur, though
quartz cement is dominating. (From Avseth et al. 2009)
50
100
150
2050
2100
2150
2200
GR
Depth (m)
0
5
10
2050
2100
2150
2200
Cement volume %
Qz cement from thin section
Total cement from thin section
Fig. 18.10 The estimated cement volume based on rock physics models (black line in right-hand subplot) compared with
point-count cement volume in the upper 100 m of the Heimdal
reservoir sands in the well analysed in Figs. 18.7 and 18.8. The
estimated cement volume is slightly larger than the pointcounted quartz cement, but for most of the depth-range it
matches nicely with the point-counted total cement volume.
(From Avseth et al. 2009)
18 Explorational Rock Physics: The Link between Geological Processes. . .
463