

Figure 18.7 shows an example from Avseth et al.
(2009). Here, the rock physics diagnostics is done in
the Vs versus porosity domain, in order to avoid significant pore fluid effects. The cement volume is estimated by interpolating between the constant cement
volume trends. For a given constant cement trend,
sorting is defined to vary between 1 and 0. Sorting
equals 1 for data points that fall right on the contact
cement model. Deteriorating sorting implies increasing volume of pore-filling (non-cementing) material
which will cause lower porosities. The data points will
then plot further away from the contact cement model,
towards zero porosity. At the zero porosity end member, sorting is defined to be zero. It is important to note
that this definition of sorting is not the same as the
qualitative sorting parameter defined in the field of
sedimentology, but they will be highly correlated,
with values approaching 0 when sands are poorly sorted
and values approaching 1 when sands are well sorted.
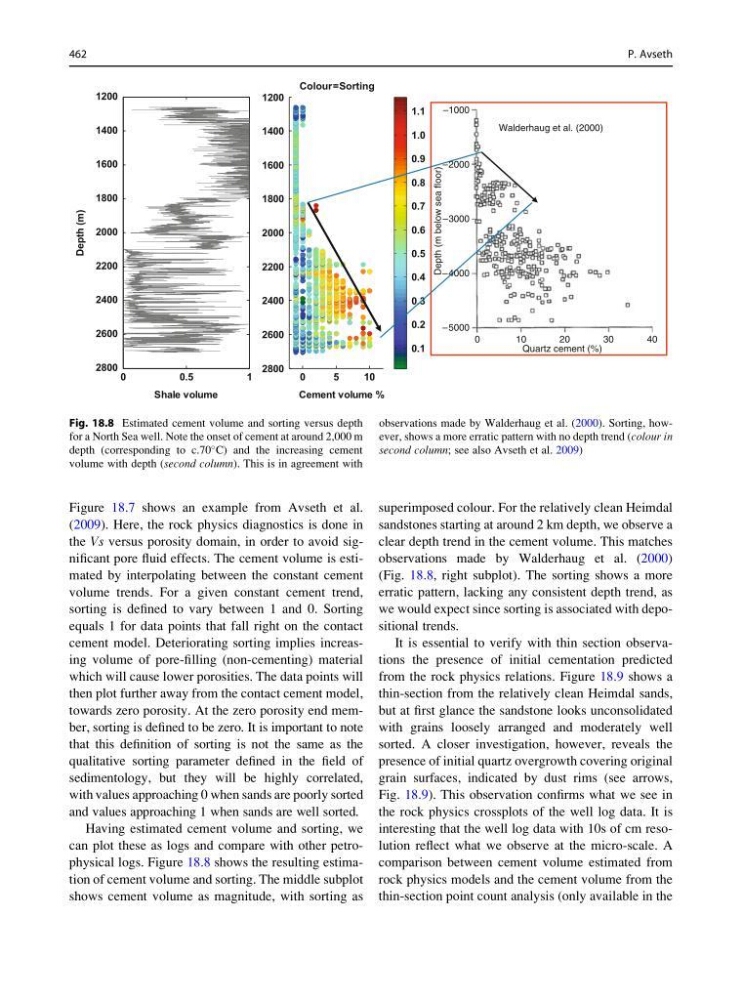
Having estimated cement volume and sorting, we
can plot these as logs and compare with other petrophysical logs. Figure 18.8 shows the resulting estimation of cement volume and sorting. The middle subplot
shows cement volume as magnitude, with sorting as
superimposed colour. For the relatively clean Heimdal
sandstones starting at around 2 km depth, we observe a
clear depth trend in the cement volume. This matches
observations made by Walderhaug et al. (2000)
(Fig. 18.8, right subplot). The sorting shows a more
erratic pattern, lacking any consistent depth trend, as
we would expect since sorting is associated with depositional trends.
It is essential to verify with thin section observations the presence of initial cementation predicted
from the rock physics relations. Figure 18.9 shows a
thin-section from the relatively clean Heimdal sands,
but at first glance the sandstone looks unconsolidated
with grains loosely arranged and moderately well
sorted. A closer investigation, however, reveals the
presence of initial quartz overgrowth covering original
grain surfaces, indicated by dust rims (see arrows,
Fig. 18.9). This observation confirms what we see in
the rock physics crossplots of the well log data. It is
interesting that the well log data with 10s of cm resolution reflect what we observe at the micro-scale. A
comparison between cement volume estimated from
rock physics models and the cement volume from the
thin-section point count analysis (only available in the
0
0.5
1
1200
1400
1600
1800
2000
2200
2400
2600
2800
Shale volume
Depth (m)
0
5
10
1200
1400
1600
1800
2000
2200
2400
2600
2800
Colour=Sorting
Cement volume %
0.1
0.2
0.3
0.4
0.5
0.6
0.7
0.8
0.9
1.0
1.1
Walderhaug et al. (2000)
Quartz cement (%)
0
–5000
–4000
Depth (m below sea floor)
–3000
–2000
–1000
10
20
30
40
Fig. 18.8 Estimated cement volume and sorting versus depth
for a North Sea well. Note the onset of cement at around 2,000 m
depth (corresponding to c.70
C) and the increasing cement
volume with depth (second column). This is in agreement with
observations made by Walderhaug et al. (2000). Sorting, however, shows a more erratic pattern with no depth trend (colour in
second column; see also Avseth et al. 2009)
462
P. Avseth
(2009). Here, the rock physics diagnostics is done in
the Vs versus porosity domain, in order to avoid significant pore fluid effects. The cement volume is estimated by interpolating between the constant cement
volume trends. For a given constant cement trend,
sorting is defined to vary between 1 and 0. Sorting
equals 1 for data points that fall right on the contact
cement model. Deteriorating sorting implies increasing volume of pore-filling (non-cementing) material
which will cause lower porosities. The data points will
then plot further away from the contact cement model,
towards zero porosity. At the zero porosity end member, sorting is defined to be zero. It is important to note
that this definition of sorting is not the same as the
qualitative sorting parameter defined in the field of
sedimentology, but they will be highly correlated,
with values approaching 0 when sands are poorly sorted
and values approaching 1 when sands are well sorted.
Having estimated cement volume and sorting, we
can plot these as logs and compare with other petrophysical logs. Figure 18.8 shows the resulting estimation of cement volume and sorting. The middle subplot
shows cement volume as magnitude, with sorting as
superimposed colour. For the relatively clean Heimdal
sandstones starting at around 2 km depth, we observe a
clear depth trend in the cement volume. This matches
observations made by Walderhaug et al. (2000)
(Fig. 18.8, right subplot). The sorting shows a more
erratic pattern, lacking any consistent depth trend, as
we would expect since sorting is associated with depositional trends.
It is essential to verify with thin section observations the presence of initial cementation predicted
from the rock physics relations. Figure 18.9 shows a
thin-section from the relatively clean Heimdal sands,
but at first glance the sandstone looks unconsolidated
with grains loosely arranged and moderately well
sorted. A closer investigation, however, reveals the
presence of initial quartz overgrowth covering original
grain surfaces, indicated by dust rims (see arrows,
Fig. 18.9). This observation confirms what we see in
the rock physics crossplots of the well log data. It is
interesting that the well log data with 10s of cm resolution reflect what we observe at the micro-scale. A
comparison between cement volume estimated from
rock physics models and the cement volume from the
thin-section point count analysis (only available in the
0
0.5
1
1200
1400
1600
1800
2000
2200
2400
2600
2800
Shale volume
Depth (m)
0
5
10
1200
1400
1600
1800
2000
2200
2400
2600
2800
Colour=Sorting
Cement volume %
0.1
0.2
0.3
0.4
0.5
0.6
0.7
0.8
0.9
1.0
1.1
Walderhaug et al. (2000)
Quartz cement (%)
0
–5000
–4000
Depth (m below sea floor)
–3000
–2000
–1000
10
20
30
40
Fig. 18.8 Estimated cement volume and sorting versus depth
for a North Sea well. Note the onset of cement at around 2,000 m
depth (corresponding to c.70
C) and the increasing cement
volume with depth (second column). This is in agreement with
observations made by Walderhaug et al. (2000). Sorting, however, shows a more erratic pattern with no depth trend (colour in
second column; see also Avseth et al. 2009)
462
P. Avseth