

reservoir parameters, or they can be used to extrapolate beyond an observed range to predict certain “what
if” scenarios in terms of fluid or lithology substitution.
Rock physics models can also be used to estimate
expected seismic properties from observed reservoir
properties. Pore fluid and stress sensitivity in reservoir
sandstones are highly affected by reservoir heterogeneity and sandstone microstructure, and it is therefore
important to include these geological factors in the
rock physics analysis.
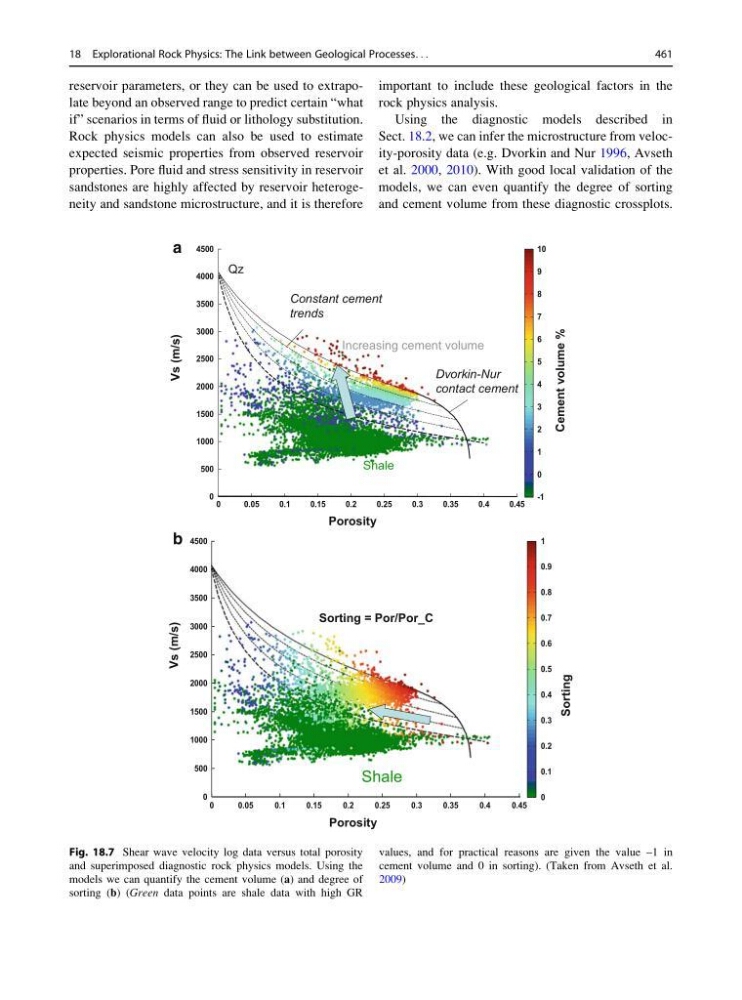
Using the diagnostic models described in
Sect. 18.2, we can infer the microstructure from velocity-porosity data (e.g. Dvorkin and Nur 1996, Avseth
et al. 2000, 2010). With good local validation of the
models, we can even quantify the degree of sorting
and cement volume from these diagnostic crossplots.
0
0.05
0.1
0.15
0.2
0.25
0.3
0.35
0.4
0.45
0
500
1000
1500
2000
2500
3000
3500
4000
4500
-1
0
1
2
3
4
5
6
7
8
9
10
Increasing cement volume
Cement volume %
Shale
Qz
Dvorkin-Nur
contact cement
Constant cement
trends
Vs (m/s)
Porosity
0
0.05
0.1
0.15
0.2
0.25
0.3
0.35
0.4
0.45
0
500
1000
1500
2000
2500
3000
3500
4000
4500
0
0.1
0.2
0.3
0.4
0.5
0.6
0.7
0.8
0.9
1
Sorting = Por/Por_C
Shale
Sorting
Vs (m/s)
Porosity
a
b
Fig. 18.7 Shear wave velocity log data versus total porosity
and superimposed diagnostic rock physics models. Using the
models we can quantify the cement volume (a) and degree of
sorting (b) (Green data points are shale data with high GR
values, and for practical reasons are given the value –1 in
cement volume and 0 in sorting). (Taken from Avseth et al.
2009)
18 Explorational Rock Physics: The Link between Geological Processes. . .
461
if” scenarios in terms of fluid or lithology substitution.
Rock physics models can also be used to estimate
expected seismic properties from observed reservoir
properties. Pore fluid and stress sensitivity in reservoir
sandstones are highly affected by reservoir heterogeneity and sandstone microstructure, and it is therefore
important to include these geological factors in the
rock physics analysis.
Using the diagnostic models described in
Sect. 18.2, we can infer the microstructure from velocity-porosity data (e.g. Dvorkin and Nur 1996, Avseth
et al. 2000, 2010). With good local validation of the
models, we can even quantify the degree of sorting
and cement volume from these diagnostic crossplots.
0
0.05
0.1
0.15
0.2
0.25
0.3
0.35
0.4
0.45
0
500
1000
1500
2000
2500
3000
3500
4000
4500
-1
0
1
2
3
4
5
6
7
8
9
10
Increasing cement volume
Cement volume %
Shale
Qz
Dvorkin-Nur
contact cement
Constant cement
trends
Vs (m/s)
Porosity
0
0.05
0.1
0.15
0.2
0.25
0.3
0.35
0.4
0.45
0
500
1000
1500
2000
2500
3000
3500
4000
4500
0
0.1
0.2
0.3
0.4
0.5
0.6
0.7
0.8
0.9
1
Sorting = Por/Por_C
Shale
Sorting
Vs (m/s)
Porosity
a
b
Fig. 18.7 Shear wave velocity log data versus total porosity
and superimposed diagnostic rock physics models. Using the
models we can quantify the cement volume (a) and degree of
sorting (b) (Green data points are shale data with high GR
values, and for practical reasons are given the value –1 in
cement volume and 0 in sorting). (Taken from Avseth et al.
2009)
18 Explorational Rock Physics: The Link between Geological Processes. . .
461