

of observed seismic waves with synthetic traces
computed from a geological model give some insight
into the depositional environment of the sand, and
hence help to predict its geometry and internal reservoir characteristics (Fig. 17.32).
There are now more than 100 distinct seismic
attributes calculated from seismic data that can be
applied to the interpretation of geological structures,
stratigraphy, and rock/pore fluid properties. Taner
et al. (1994) divide attributes into two general
categories: geometrical and physical. The objective
of geometrical attributes is to enhance the visibility
of the geometrical characteristics of seismic data; they
include dip, azimuth, and continuity. Physical
attributes have to do with the physical parameters of
the subsurface and so relate to lithology. These include
amplitude, phase and frequency. Liner et al. (2004)
classified attributes into general and specific
categories. The general attributes are measures of
geometric, kinematic, dynamic or statistical features
derived from seismic data. They include reflector
amplitude, reflector time, reflector dip and azimuth,
complex amplitude and frequency, generalised Hilbert
attributes, illumination, edge detection/coherence,
AVO and spectral decomposition. General attributes
are based on either the physical or morphological
character of the data tied to lithology or geology and
are therefore generally applicable from basin to basin
around the world. In contrast, specific attributes have a
less well-defined basis in physics or geology. While a
given specific attribute may be well correlated to a
geological feature or to reservoir productivity within a
given basin, these correlations do not in general carry
over to a different basin.
Over the past decades, we have witnessed attribute
developments tracking the breakthroughs in reflector
acquisition and mapping, fault identification,
bright-spot identification, frequency loss, thin-bed
tuning, seismic stratigraphy and geomorphology
(Fig. 17.33). More recently, interpreters have used
crossplotting to identify clusters of attributes
associated with either stratigraphic or hydrocarbon
anomalies. Today, very powerful computer
workstations capable of integrating large volumes of
diverse data and calculating numerous seismic
attributes are a routine tool used by seismic
interpreters seeking geological and reservoir engineering information from seismic data.
a
5000
1100
1200
Time (ms)
5000
N o r t h
10000
0.0
1.0
1 km
1 km
10000
5000
1100
1200
Time (ms)
5000
Channel/levee deposits
N o r t h
10000
0.0
1.0
10000
b
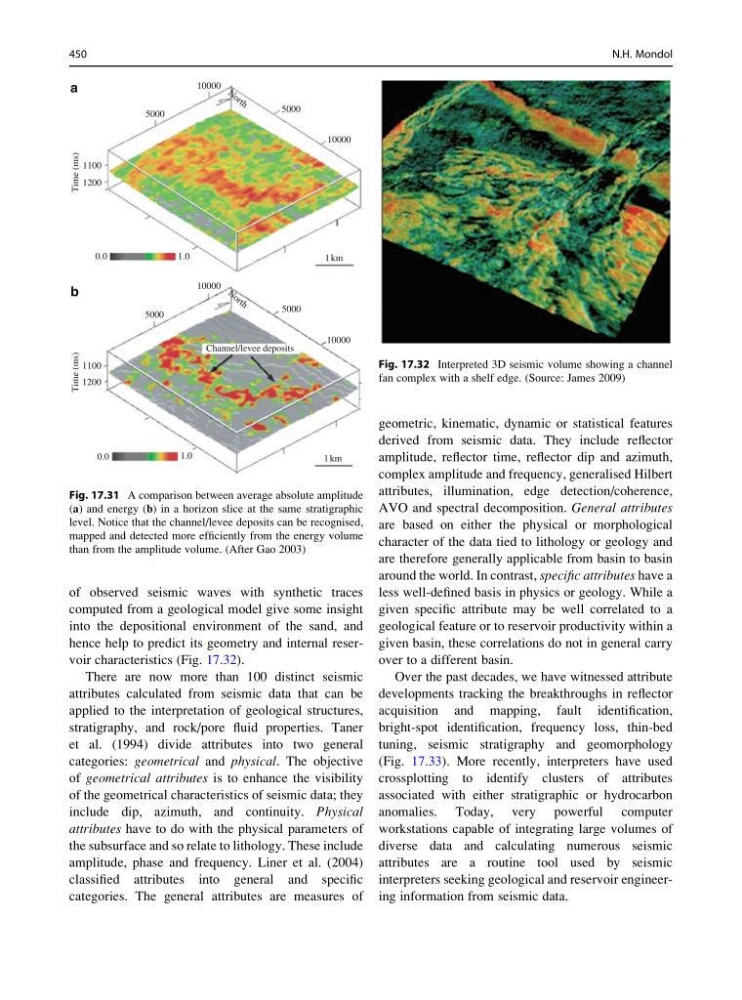
Fig. 17.31 A comparison between average absolute amplitude
(a) and energy (b) in a horizon slice at the same stratigraphic
level. Notice that the channel/levee deposits can be recognised,
mapped and detected more efficiently from the energy volume
than from the amplitude volume. (After Gao 2003)
Fig. 17.32 Interpreted 3D seismic volume showing a channel
fan complex with a shelf edge. (Source: James 2009)
450
N.H. Mondol
computed from a geological model give some insight
into the depositional environment of the sand, and
hence help to predict its geometry and internal reservoir characteristics (Fig. 17.32).
There are now more than 100 distinct seismic
attributes calculated from seismic data that can be
applied to the interpretation of geological structures,
stratigraphy, and rock/pore fluid properties. Taner
et al. (1994) divide attributes into two general
categories: geometrical and physical. The objective
of geometrical attributes is to enhance the visibility
of the geometrical characteristics of seismic data; they
include dip, azimuth, and continuity. Physical
attributes have to do with the physical parameters of
the subsurface and so relate to lithology. These include
amplitude, phase and frequency. Liner et al. (2004)
classified attributes into general and specific
categories. The general attributes are measures of
geometric, kinematic, dynamic or statistical features
derived from seismic data. They include reflector
amplitude, reflector time, reflector dip and azimuth,
complex amplitude and frequency, generalised Hilbert
attributes, illumination, edge detection/coherence,
AVO and spectral decomposition. General attributes
are based on either the physical or morphological
character of the data tied to lithology or geology and
are therefore generally applicable from basin to basin
around the world. In contrast, specific attributes have a
less well-defined basis in physics or geology. While a
given specific attribute may be well correlated to a
geological feature or to reservoir productivity within a
given basin, these correlations do not in general carry
over to a different basin.
Over the past decades, we have witnessed attribute
developments tracking the breakthroughs in reflector
acquisition and mapping, fault identification,
bright-spot identification, frequency loss, thin-bed
tuning, seismic stratigraphy and geomorphology
(Fig. 17.33). More recently, interpreters have used
crossplotting to identify clusters of attributes
associated with either stratigraphic or hydrocarbon
anomalies. Today, very powerful computer
workstations capable of integrating large volumes of
diverse data and calculating numerous seismic
attributes are a routine tool used by seismic
interpreters seeking geological and reservoir engineering information from seismic data.
a
5000
1100
1200
Time (ms)
5000
N o r t h
10000
0.0
1.0
1 km
1 km
10000
5000
1100
1200
Time (ms)
5000
Channel/levee deposits
N o r t h
10000
0.0
1.0
10000
b
Fig. 17.31 A comparison between average absolute amplitude
(a) and energy (b) in a horizon slice at the same stratigraphic
level. Notice that the channel/levee deposits can be recognised,
mapped and detected more efficiently from the energy volume
than from the amplitude volume. (After Gao 2003)
Fig. 17.32 Interpreted 3D seismic volume showing a channel
fan complex with a shelf edge. (Source: James 2009)
450
N.H. Mondol