

17.7.4 Seismic Sequence Analysis
Apart from structural and facies analysis, seismic
signatures can be used to interpret the way the basin
has been filled in. This is a result of an interaction
between the rate of subsidence, rate of deposition and
the energy of the depositional environment
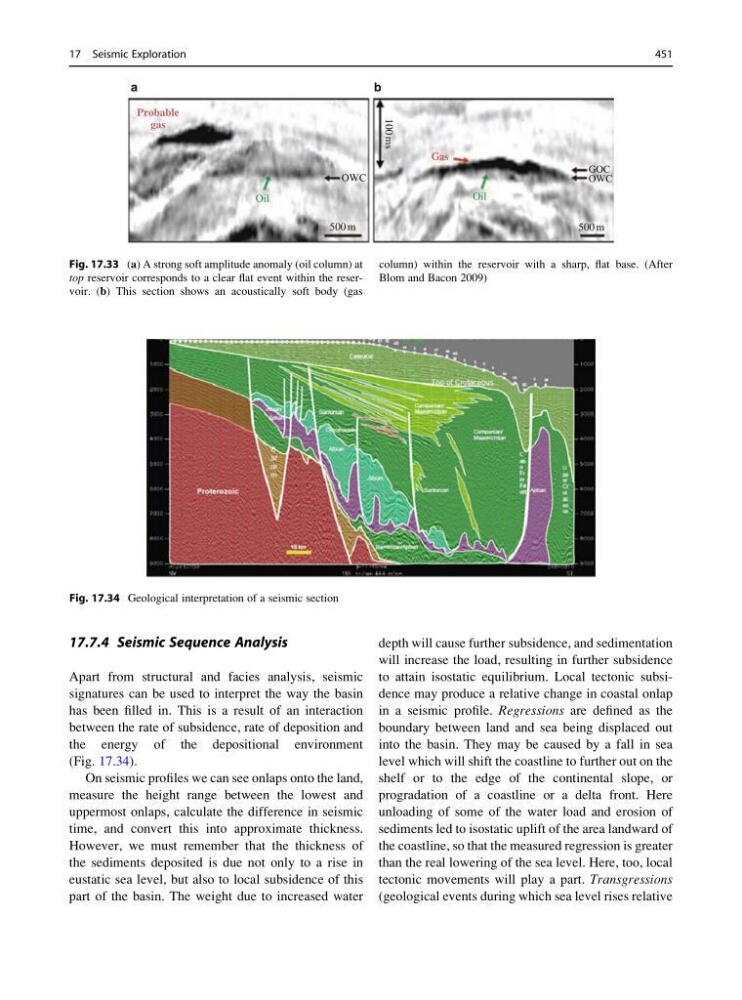
(Fig. 17.34).
On seismic profiles we can see onlaps onto the land,
measure the height range between the lowest and
uppermost onlaps, calculate the difference in seismic
time, and convert this into approximate thickness.
However, we must remember that the thickness of
the sediments deposited is due not only to a rise in
eustatic sea level, but also to local subsidence of this
part of the basin. The weight due to increased water
depth will cause further subsidence, and sedimentation
will increase the load, resulting in further subsidence
to attain isostatic equilibrium. Local tectonic subsidence may produce a relative change in coastal onlap
in a seismic profile. Regressions are defined as the
boundary between land and sea being displaced out
into the basin. They may be caused by a fall in sea
level which will shift the coastline to further out on the
shelf or to the edge of the continental slope, or
progradation of a coastline or a delta front. Here
unloading of some of the water load and erosion of
sediments led to isostatic uplift of the area landward of
the coastline, so that the measured regression is greater
than the real lowering of the sea level. Here, too, local
tectonic movements will play a part. Transgressions
(geological events during which sea level rises relative
Probable
gas
Oil
Oil
Gas
GOC
OWC
OWC
a
b
500 m
500 m
100 ms
Fig. 17.33 (a) A strong soft amplitude anomaly (oil column) at
top reservoir corresponds to a clear flat event within the reservoir. (b) This section shows an acoustically soft body (gas
column) within the reservoir with a sharp, flat base. (After
Blom and Bacon 2009)
Fig. 17.34 Geological interpretation of a seismic section
17 Seismic Exploration
451
Apart from structural and facies analysis, seismic
signatures can be used to interpret the way the basin
has been filled in. This is a result of an interaction
between the rate of subsidence, rate of deposition and
the energy of the depositional environment
(Fig. 17.34).
On seismic profiles we can see onlaps onto the land,
measure the height range between the lowest and
uppermost onlaps, calculate the difference in seismic
time, and convert this into approximate thickness.
However, we must remember that the thickness of
the sediments deposited is due not only to a rise in
eustatic sea level, but also to local subsidence of this
part of the basin. The weight due to increased water
depth will cause further subsidence, and sedimentation
will increase the load, resulting in further subsidence
to attain isostatic equilibrium. Local tectonic subsidence may produce a relative change in coastal onlap
in a seismic profile. Regressions are defined as the
boundary between land and sea being displaced out
into the basin. They may be caused by a fall in sea
level which will shift the coastline to further out on the
shelf or to the edge of the continental slope, or
progradation of a coastline or a delta front. Here
unloading of some of the water load and erosion of
sediments led to isostatic uplift of the area landward of
the coastline, so that the measured regression is greater
than the real lowering of the sea level. Here, too, local
tectonic movements will play a part. Transgressions
(geological events during which sea level rises relative
Probable
gas
Oil
Oil
Gas
GOC
OWC
OWC
a
b
500 m
500 m
100 ms
Fig. 17.33 (a) A strong soft amplitude anomaly (oil column) at
top reservoir corresponds to a clear flat event within the reservoir. (b) This section shows an acoustically soft body (gas
column) within the reservoir with a sharp, flat base. (After
Blom and Bacon 2009)
Fig. 17.34 Geological interpretation of a seismic section
17 Seismic Exploration
451