

and uninvaded zones (R t ) (Fig. 16.32). Note that the
degree of underestimation or overestimation in R t and
R w leads to significant error in saturation calculation.
Estimation of m and n In attempting to reduce errors
in S w calculation we must ensure that the m and n
parameters in Archie’s equation are measured using
independent methods. Laboratory determined m and n
values are the best ones to take, though early in a
reservoir’s life these are not available, and so guesses
are used instead. Note that 20% underestimations and
overestimations of m and n lead to an underestimation
and overestimation of the water saturation by 0.11 and
0.12 respectively. These are huge errors when
progressed through to the STOOIP (stock tank oil
originally in place) calculation.
16.5.8 Dipmeter Logs
16.5.8.1 Generalities and Basic Principles
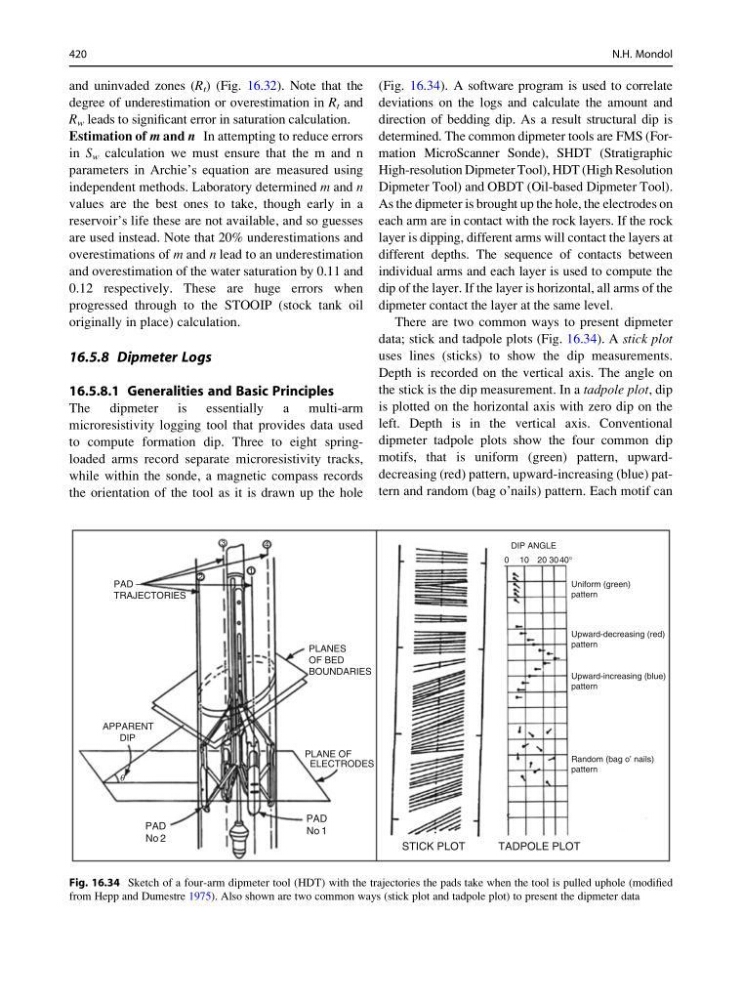
The dipmeter is essentially a multi-arm
microresistivity logging tool that provides data used
to compute formation dip. Three to eight springloaded arms record separate microresistivity tracks,
while within the sonde, a magnetic compass records
the orientation of the tool as it is drawn up the hole
(Fig. 16.34). A software program is used to correlate
deviations on the logs and calculate the amount and
direction of bedding dip. As a result structural dip is
determined. The common dipmeter tools are FMS (Formation MicroScanner Sonde), SHDT (Stratigraphic
High-resolution Dipmeter Tool), HDT (High Resolution
Dipmeter Tool) and OBDT (Oil-based Dipmeter Tool).
As the dipmeter is brought up the hole, the electrodes on
each arm are in contact with the rock layers. If the rock
layer is dipping, different arms will contact the layers at
different depths. The sequence of contacts between
individual arms and each layer is used to compute the
dip of the layer. If the layer is horizontal, all arms of the
dipmeter contact the layer at the same level.
There are two common ways to present dipmeter
data; stick and tadpole plots (Fig. 16.34). A stick plot
uses lines (sticks) to show the dip measurements.
Depth is recorded on the vertical axis. The angle on
the stick is the dip measurement. In a tadpole plot, dip
is plotted on the horizontal axis with zero dip on the
left. Depth is in the vertical axis. Conventional
dipmeter tadpole plots show the four common dip
motifs, that is uniform (green) pattern, upwarddecreasing (red) pattern, upward-increasing (blue) pattern and random (bag o’nails) pattern. Each motif can
PAD –
TRAJECTORIES
APPARENT
DIP
PAD
No 2
PAD
No 1
PLANE OF
ELECTRODES
PLANES
OF BED
BOUNDARIES
1
2
3
4
STICK PLOT
TADPOLE PLOT
Random (bag o’ nails)
pattern
Upward-increasing (blue)
pattern
Upward-decreasing (red)
pattern
Uniform (green)
pattern
DIP ANGLE
0 10 20 30 40°
q
Fig. 16.34 Sketch of a four-arm dipmeter tool (HDT) with the trajectories the pads take when the tool is pulled uphole (modified
from Hepp and Dumestre 1975). Also shown are two common ways (stick plot and tadpole plot) to present the dipmeter data
420
N.H. Mondol
degree of underestimation or overestimation in R t and
R w leads to significant error in saturation calculation.
Estimation of m and n In attempting to reduce errors
in S w calculation we must ensure that the m and n
parameters in Archie’s equation are measured using
independent methods. Laboratory determined m and n
values are the best ones to take, though early in a
reservoir’s life these are not available, and so guesses
are used instead. Note that 20% underestimations and
overestimations of m and n lead to an underestimation
and overestimation of the water saturation by 0.11 and
0.12 respectively. These are huge errors when
progressed through to the STOOIP (stock tank oil
originally in place) calculation.
16.5.8 Dipmeter Logs
16.5.8.1 Generalities and Basic Principles
The dipmeter is essentially a multi-arm
microresistivity logging tool that provides data used
to compute formation dip. Three to eight springloaded arms record separate microresistivity tracks,
while within the sonde, a magnetic compass records
the orientation of the tool as it is drawn up the hole
(Fig. 16.34). A software program is used to correlate
deviations on the logs and calculate the amount and
direction of bedding dip. As a result structural dip is
determined. The common dipmeter tools are FMS (Formation MicroScanner Sonde), SHDT (Stratigraphic
High-resolution Dipmeter Tool), HDT (High Resolution
Dipmeter Tool) and OBDT (Oil-based Dipmeter Tool).
As the dipmeter is brought up the hole, the electrodes on
each arm are in contact with the rock layers. If the rock
layer is dipping, different arms will contact the layers at
different depths. The sequence of contacts between
individual arms and each layer is used to compute the
dip of the layer. If the layer is horizontal, all arms of the
dipmeter contact the layer at the same level.
There are two common ways to present dipmeter
data; stick and tadpole plots (Fig. 16.34). A stick plot
uses lines (sticks) to show the dip measurements.
Depth is recorded on the vertical axis. The angle on
the stick is the dip measurement. In a tadpole plot, dip
is plotted on the horizontal axis with zero dip on the
left. Depth is in the vertical axis. Conventional
dipmeter tadpole plots show the four common dip
motifs, that is uniform (green) pattern, upwarddecreasing (red) pattern, upward-increasing (blue) pattern and random (bag o’nails) pattern. Each motif can
PAD –
TRAJECTORIES
APPARENT
DIP
PAD
No 2
PAD
No 1
PLANE OF
ELECTRODES
PLANES
OF BED
BOUNDARIES
1
2
3
4
STICK PLOT
TADPOLE PLOT
Random (bag o’ nails)
pattern
Upward-increasing (blue)
pattern
Upward-decreasing (red)
pattern
Uniform (green)
pattern
DIP ANGLE
0 10 20 30 40°
q
Fig. 16.34 Sketch of a four-arm dipmeter tool (HDT) with the trajectories the pads take when the tool is pulled uphole (modified
from Hepp and Dumestre 1975). Also shown are two common ways (stick plot and tadpole plot) to present the dipmeter data
420
N.H. Mondol