

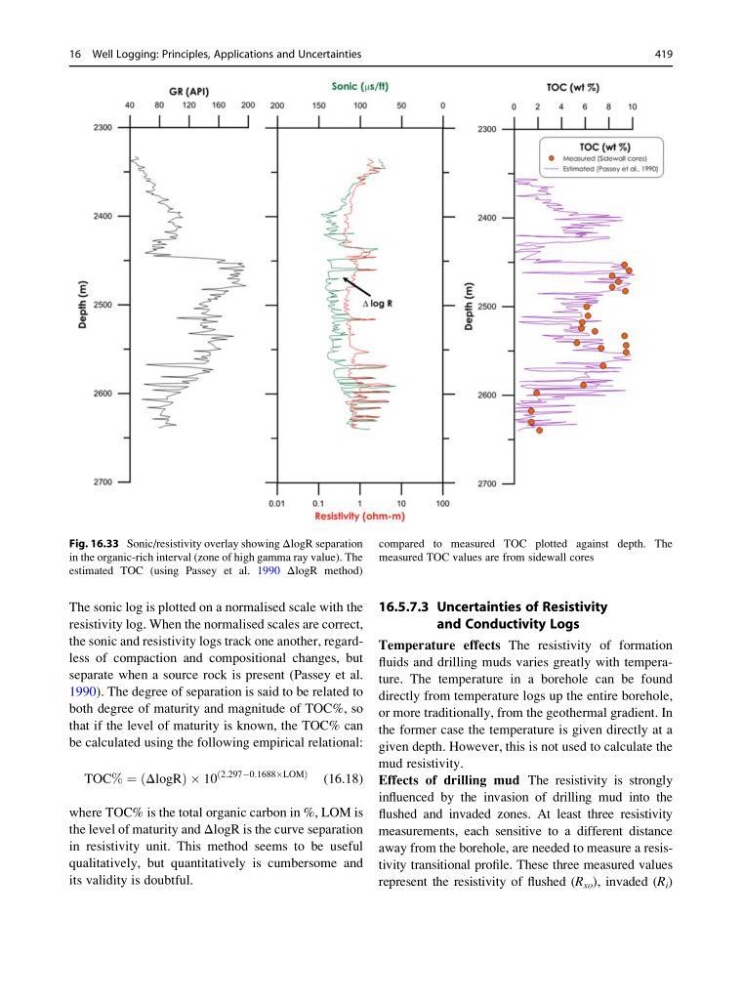
The sonic log is plotted on a normalised scale with the
resistivity log. When the normalised scales are correct,
the sonic and resistivity logs track one another, regardless of compaction and compositional changes, but
separate when a source rock is present (Passey et al.
1990). The degree of separation is said to be related to
both degree of maturity and magnitude of TOC%, so
that if the level of maturity is known, the TOC% can
be calculated using the following empirical relational:
TOC% ¼ ΔlogR
ð
ÞÂ10
2:297À0:1688ÂLOM
ð
Þ
(16.18)
where TOC% is the total organic carbon in %, LOM is
the level of maturity and ΔlogR is the curve separation
in resistivity unit. This method seems to be useful
qualitatively, but quantitatively is cumbersome and
its validity is doubtful.
16.5.7.3 Uncertainties of Resistivity
and Conductivity Logs
Temperature effects The resistivity of formation
fluids and drilling muds varies greatly with temperature. The temperature in a borehole can be found
directly from temperature logs up the entire borehole,
or more traditionally, from the geothermal gradient. In
the former case the temperature is given directly at a
given depth. However, this is not used to calculate the
mud resistivity.
Effects of drilling mud The resistivity is strongly
influenced by the invasion of drilling mud into the
flushed and invaded zones. At least three resistivity
measurements, each sensitive to a different distance
away from the borehole, are needed to measure a resistivity transitional profile. These three measured values
represent the resistivity of flushed (R xo ), invaded (R i )
Fig. 16.33 Sonic/resistivity overlay showing ΔlogR separation
in the organic-rich interval (zone of high gamma ray value). The
estimated TOC (using Passey et al. 1990 ΔlogR method)
compared to measured TOC plotted against depth. The
measured TOC values are from sidewall cores
16 Well Logging: Principles, Applications and Uncertainties
419
resistivity log. When the normalised scales are correct,
the sonic and resistivity logs track one another, regardless of compaction and compositional changes, but
separate when a source rock is present (Passey et al.
1990). The degree of separation is said to be related to
both degree of maturity and magnitude of TOC%, so
that if the level of maturity is known, the TOC% can
be calculated using the following empirical relational:
TOC% ¼ ΔlogR
ð
ÞÂ10
2:297À0:1688ÂLOM
ð
Þ
(16.18)
where TOC% is the total organic carbon in %, LOM is
the level of maturity and ΔlogR is the curve separation
in resistivity unit. This method seems to be useful
qualitatively, but quantitatively is cumbersome and
its validity is doubtful.
16.5.7.3 Uncertainties of Resistivity
and Conductivity Logs
Temperature effects The resistivity of formation
fluids and drilling muds varies greatly with temperature. The temperature in a borehole can be found
directly from temperature logs up the entire borehole,
or more traditionally, from the geothermal gradient. In
the former case the temperature is given directly at a
given depth. However, this is not used to calculate the
mud resistivity.
Effects of drilling mud The resistivity is strongly
influenced by the invasion of drilling mud into the
flushed and invaded zones. At least three resistivity
measurements, each sensitive to a different distance
away from the borehole, are needed to measure a resistivity transitional profile. These three measured values
represent the resistivity of flushed (R xo ), invaded (R i )
Fig. 16.33 Sonic/resistivity overlay showing ΔlogR separation
in the organic-rich interval (zone of high gamma ray value). The
estimated TOC (using Passey et al. 1990 ΔlogR method)
compared to measured TOC plotted against depth. The
measured TOC values are from sidewall cores
16 Well Logging: Principles, Applications and Uncertainties
419