

and check the seismic data. In general, the sonic log
resolution is about 60 cm compared to seismic
10–50 m. Therefore, the sonic log must be averaged
when comparing it with seismic measurement. However, the much higher resolution of the sonic log may
enable the log information to resolve indications of
beds that are just beyond the resolution of the seismic
technique. Note that the sonic log gives a one-way
travel time, and the seismic technique gives a twoway travel time.
A synthetic seismogram is a seismic trace that has
been constructed from various parameters obtainable
from log information. It represents the seismic trace
that should be observed with the seismic method at the
well location. It is useful to compare such a synthetic
seismogram with the real seismic trace measured at
the well location to improve the picking of seismic
horizons, and to improve the accuracy and resolution
of formations of interest. It should be remembered that
the observed seismic trace is primarily a record of the
ability of interfaces between formations to reflect elastic waves. This ability is called the reflection coefficient R. The reflection coefficient depends upon the
properties of the rock either side of the interface, and
in particular on its acoustic impedance. The acoustic
impedance is the product of the seismic velocity and
the density of the rock. Thus, if we can derive the
density and seismic velocity of a set of formations
from logs, we can produce a synthetic seismogram
(Fig. 16.26).
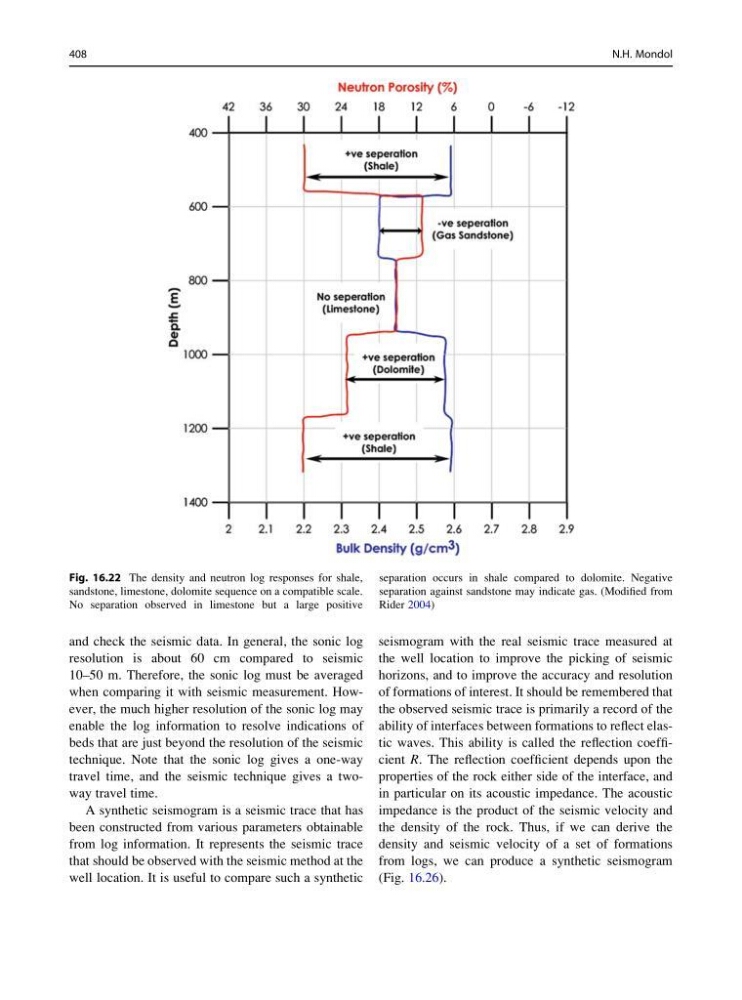
Fig. 16.22 The density and neutron log responses for shale,
sandstone, limestone, dolomite sequence on a compatible scale.
No separation observed in limestone but a large positive
separation occurs in shale compared to dolomite. Negative
separation against sandstone may indicate gas. (Modified from
Rider 2004)
408
N.H. Mondol
resolution is about 60 cm compared to seismic
10–50 m. Therefore, the sonic log must be averaged
when comparing it with seismic measurement. However, the much higher resolution of the sonic log may
enable the log information to resolve indications of
beds that are just beyond the resolution of the seismic
technique. Note that the sonic log gives a one-way
travel time, and the seismic technique gives a twoway travel time.
A synthetic seismogram is a seismic trace that has
been constructed from various parameters obtainable
from log information. It represents the seismic trace
that should be observed with the seismic method at the
well location. It is useful to compare such a synthetic
seismogram with the real seismic trace measured at
the well location to improve the picking of seismic
horizons, and to improve the accuracy and resolution
of formations of interest. It should be remembered that
the observed seismic trace is primarily a record of the
ability of interfaces between formations to reflect elastic waves. This ability is called the reflection coefficient R. The reflection coefficient depends upon the
properties of the rock either side of the interface, and
in particular on its acoustic impedance. The acoustic
impedance is the product of the seismic velocity and
the density of the rock. Thus, if we can derive the
density and seismic velocity of a set of formations
from logs, we can produce a synthetic seismogram
(Fig. 16.26).
Fig. 16.22 The density and neutron log responses for shale,
sandstone, limestone, dolomite sequence on a compatible scale.
No separation observed in limestone but a large positive
separation occurs in shale compared to dolomite. Negative
separation against sandstone may indicate gas. (Modified from
Rider 2004)
408
N.H. Mondol