

carbonate or sandstone. This unrealistically high
porosity is a good indicator of shale, and can become
diagnostic when combined with the gamma ray log.
One can see from the neutron-density crossplot that
there will be a separation of the density and the neutron logs for sandstone and dolomite, but no separation
for limestone (Fig. 16.22). The sandstone separation is
called negative and the dolomite separation, which is
in the other direction and slightly larger, is called
positive. If shale is present in the formation, the neutron log reads much higher porosities and gives a large
positive separation. If the shale volume decreases due
to the intermixture of sandstone, the large positive
separation decreases, crosses over and becomes eventually the small negative separation associated with
pure sandstone. Thus, a sequence of clearly defined
sand and shale formations shows switching between
positive and negative separations in a neutron-density
crossplot.
Detection of Gas
The rules governing the relationship between neutron
log porosity and the true porosity in clean formations
are valid when either water or oil fills the pores (the
two fluids have essentially the same hydrogen index,
Rider 2004). However, hydrocarbon gas has a much
lower hydrocarbon index resulting from its low
density, and its presence will give rise to
underestimations in porosity. On the neutron-density
combination, gas stands out very distinctly, giving a
large negative separation (Fig. 16.23).
Detection of Overpressure
Sonic logs can be used to detect overpressured zones
in a well. An increase in pore pressures causes a clear
drop in sonic velocity (i.e. an increase in sonic travel
time). Fluid overpressure works against any compaction trend caused by the overburden pressure. Hence, it
is likely that overpressured zones will retain a greater
porosity than normally pressured zones. If a normal
compaction or no compaction is observed in a shale
over some depth interval, and below it the bulk density
begins to decrease (or the derived porosity begins to
increase) without change in lithology, it is likely that
one has entered a zone of overpressured fluids. In this
zone the overpressured fluids keep the porosity open,
stopping any compaction trend and reversing it
(Fig. 16.24).
Uplift Estimation
As sediments become compacted, the velocity of elastic waves through them increases. If one plots the
interval transit time on a logarithmic scale against
depth on a linear scale, a straight line relationship
emerges. This is called compaction trend. Compaction
trends are constructed for single lithologies, comparing the same stratigraphic interval at different depths.
It is possible to estimate the amount of erosion at
unconformities or the amount of uplift from these
trends. This is because compaction is generally
accompanied by diagenetic changes which do not
alter after uplift. Hence the compaction of a sediment
represents its deepest burial. Figure 16.25 compares
the compaction trend for the same lithology in the
same stratigraphic interval in one well with that in
another well. The data from the well represented by
the circles shows the interval to have been uplifted by
800 m relative to the other well because it has lower
interval transit times (means more compact) but
occurs at a shallower depth.
Seismic Data Calibration and
Synthetic Seismogram Generation
A sonic log in a well located on a seismic line or in a
3D survey enables the log data to be used to calibrate
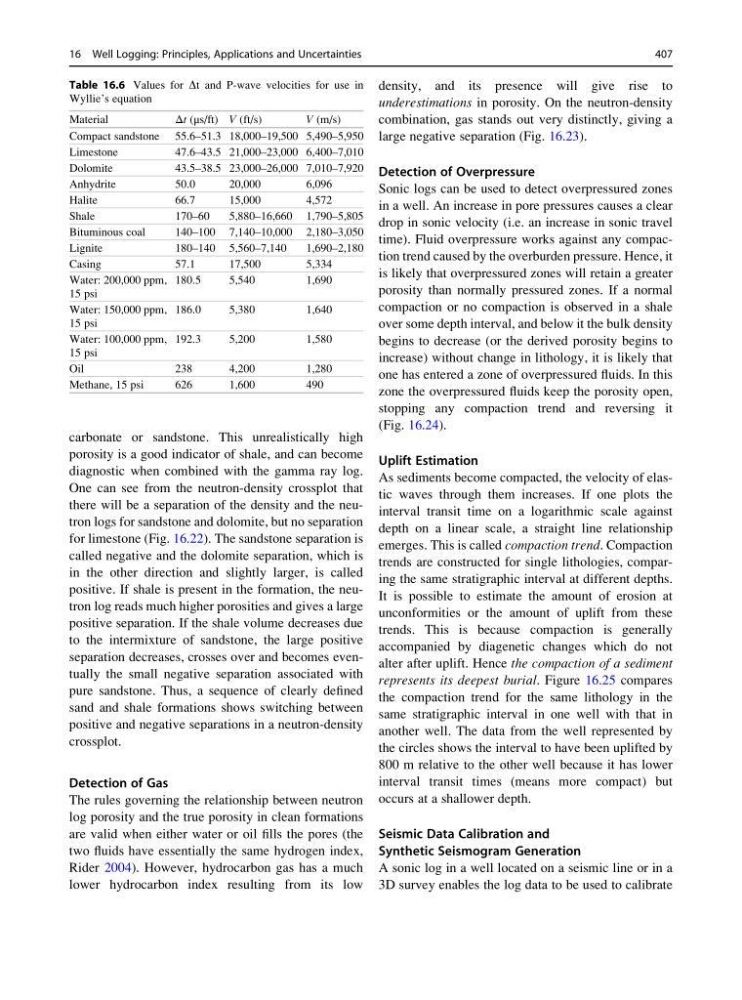
Table 16.6 Values for Dt and P-wave velocities for use in
Wyllie’s equation
Material
Δt (μs/ft) V (ft/s)
V (m/s)
Compact sandstone 55.6–51.3 18,000–19,500 5,490–5,950
Limestone
47.6–43.5 21,000–23,000 6,400–7,010
Dolomite
43.5–38.5 23,000–26,000 7,010–7,920
Anhydrite
50.0
20,000
6,096
Halite
66.7
15,000
4,572
Shale
170–60
5,880–16,660 1,790–5,805
Bituminous coal
140–100 7,140–10,000 2,180–3,050
Lignite
180–140 5,560–7,140
1,690–2,180
Casing
57.1
17,500
5,334
Water: 200,000 ppm,
15 psi
180.5
5,540
1,690
Water: 150,000 ppm,
15 psi
186.0
5,380
1,640
Water: 100,000 ppm,
15 psi
192.3
5,200
1,580
Oil
238
4,200
1,280
Methane, 15 psi
626
1,600
490
16 Well Logging: Principles, Applications and Uncertainties
407
porosity is a good indicator of shale, and can become
diagnostic when combined with the gamma ray log.
One can see from the neutron-density crossplot that
there will be a separation of the density and the neutron logs for sandstone and dolomite, but no separation
for limestone (Fig. 16.22). The sandstone separation is
called negative and the dolomite separation, which is
in the other direction and slightly larger, is called
positive. If shale is present in the formation, the neutron log reads much higher porosities and gives a large
positive separation. If the shale volume decreases due
to the intermixture of sandstone, the large positive
separation decreases, crosses over and becomes eventually the small negative separation associated with
pure sandstone. Thus, a sequence of clearly defined
sand and shale formations shows switching between
positive and negative separations in a neutron-density
crossplot.
Detection of Gas
The rules governing the relationship between neutron
log porosity and the true porosity in clean formations
are valid when either water or oil fills the pores (the
two fluids have essentially the same hydrogen index,
Rider 2004). However, hydrocarbon gas has a much
lower hydrocarbon index resulting from its low
density, and its presence will give rise to
underestimations in porosity. On the neutron-density
combination, gas stands out very distinctly, giving a
large negative separation (Fig. 16.23).
Detection of Overpressure
Sonic logs can be used to detect overpressured zones
in a well. An increase in pore pressures causes a clear
drop in sonic velocity (i.e. an increase in sonic travel
time). Fluid overpressure works against any compaction trend caused by the overburden pressure. Hence, it
is likely that overpressured zones will retain a greater
porosity than normally pressured zones. If a normal
compaction or no compaction is observed in a shale
over some depth interval, and below it the bulk density
begins to decrease (or the derived porosity begins to
increase) without change in lithology, it is likely that
one has entered a zone of overpressured fluids. In this
zone the overpressured fluids keep the porosity open,
stopping any compaction trend and reversing it
(Fig. 16.24).
Uplift Estimation
As sediments become compacted, the velocity of elastic waves through them increases. If one plots the
interval transit time on a logarithmic scale against
depth on a linear scale, a straight line relationship
emerges. This is called compaction trend. Compaction
trends are constructed for single lithologies, comparing the same stratigraphic interval at different depths.
It is possible to estimate the amount of erosion at
unconformities or the amount of uplift from these
trends. This is because compaction is generally
accompanied by diagenetic changes which do not
alter after uplift. Hence the compaction of a sediment
represents its deepest burial. Figure 16.25 compares
the compaction trend for the same lithology in the
same stratigraphic interval in one well with that in
another well. The data from the well represented by
the circles shows the interval to have been uplifted by
800 m relative to the other well because it has lower
interval transit times (means more compact) but
occurs at a shallower depth.
Seismic Data Calibration and
Synthetic Seismogram Generation
A sonic log in a well located on a seismic line or in a
3D survey enables the log data to be used to calibrate
Table 16.6 Values for Dt and P-wave velocities for use in
Wyllie’s equation
Material
Δt (μs/ft) V (ft/s)
V (m/s)
Compact sandstone 55.6–51.3 18,000–19,500 5,490–5,950
Limestone
47.6–43.5 21,000–23,000 6,400–7,010
Dolomite
43.5–38.5 23,000–26,000 7,010–7,920
Anhydrite
50.0
20,000
6,096
Halite
66.7
15,000
4,572
Shale
170–60
5,880–16,660 1,790–5,805
Bituminous coal
140–100 7,140–10,000 2,180–3,050
Lignite
180–140 5,560–7,140
1,690–2,180
Casing
57.1
17,500
5,334
Water: 200,000 ppm,
15 psi
180.5
5,540
1,690
Water: 150,000 ppm,
15 psi
186.0
5,380
1,640
Water: 100,000 ppm,
15 psi
192.3
5,200
1,580
Oil
238
4,200
1,280
Methane, 15 psi
626
1,600
490
16 Well Logging: Principles, Applications and Uncertainties
407