

• The area under the distribution curve equals NMR
porosity.
• Permeability is estimated from the logarithmicmean T 2 and NMR porosity.
• Empirically derived cutoffs separate the T 2 distribution into areas equal to free-fluid porosity and
irreducible water porosity.
16.5.5.2 Uses of Porosity Logs
The main use of porosity logs is to provide porosity
information. In combination with sonic and density logs,
the important applications are compaction trend and uplift
estimation, overpressure detection, seismic data calibration and synthetic seismogram generation. Furthermore,
the combination of density and neutron logs give the best
ways of identifying lithologies and detecting gas-bearing
zones. Numerous uses of porosity logs are given below:
Porosity Estimation
When using a single porosity log, lithology must be
specified through the choice of a matrix value, to avoid
ambiguity in calculating porosity. Combinations of porosity logs may unravel complex matrix (e.g. quartz, calcite,
dolomite) and fluid (e.g. brine, oil, gas) compositions,
providing a more accurate porosity determination.
Porosity from Neutron Log
The neutron tool is sensitive to the amount of hydrogen
ions in the formation and to a less extent also other
elements. It is assumed that the contribution to the
measurement by elements other than hydrogen is negligible, and that the contribution to the measurement from
hydrogen comes entirely from the fluids fully occupying
the pore space. However, in real rocks, elements other
than hydrogen that exist in the rock matrix do contribute
to the measurement, and hydrogen is also present in the
matrix itself (e.g. bound water in shales). The problem is
partially overcome by calibrating the tool against limestone. Pure limestone saturated with freshwater is used
for calibration because it contains no elements which
contribute significantly to the neutron measurements
other than hydrogen. Therefore, the porosities that are
read by the tool are accurate in limestones containing
freshwater. The porosities that are read by the tool in
other lithologies or with other fluids need to be corrected
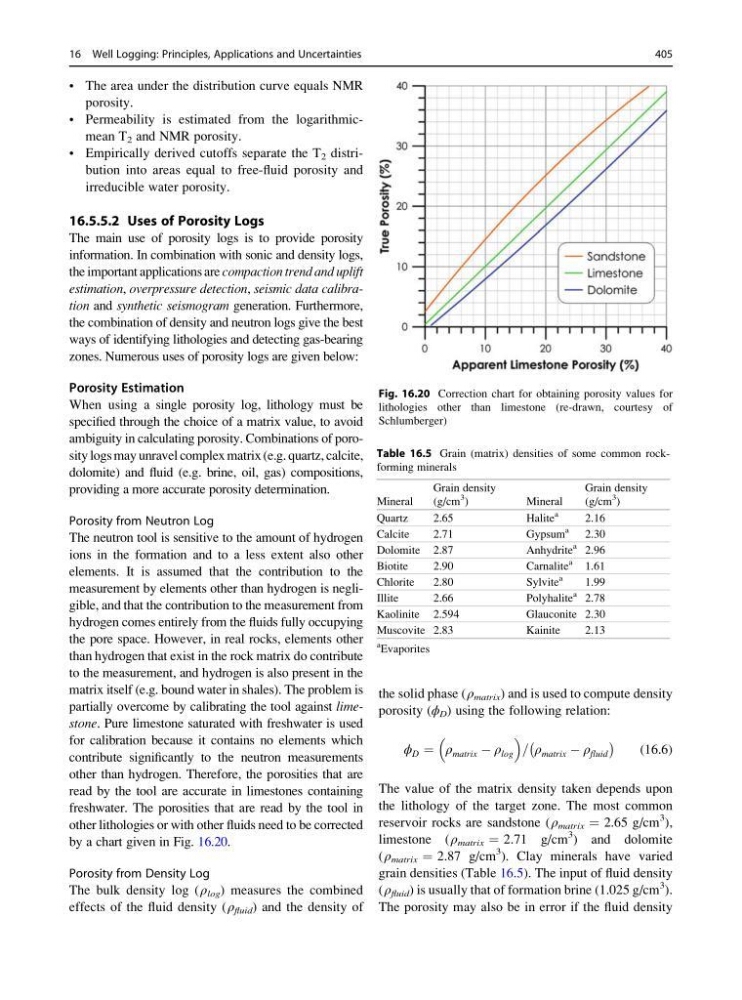
by a chart given in Fig. 16.20.
Porosity from Density Log
The bulk density log (ρ log ) measures the combined
effects of the fluid density (ρ fluid ) and the density of
the solid phase (ρ matrix ) and is used to compute density
porosity (ϕ D ) using the following relation:
ϕ D ¼ ρ matrix À ρ log
= ρ matrix À ρ fluid
À
Á
(16.6)
The value of the matrix density taken depends upon
the lithology of the target zone. The most common
reservoir rocks are sandstone (ρ matrix ¼ 2.65 g/cm
3 ),
limestone (ρ matrix ¼ 2.71 g/cm
3 ) and dolomite
(ρ matrix ¼ 2.87 g/cm
3 ). Clay minerals have varied
grain densities (Table 16.5). The input of fluid density
(ρ fluid ) is usually that of formation brine (1.025 g/cm
3 ).
The porosity may also be in error if the fluid density
Fig. 16.20 Correction chart for obtaining porosity values for
lithologies other than limestone (re-drawn, courtesy of
Schlumberger)
Table 16.5 Grain (matrix) densities of some common rockforming minerals
Mineral
Grain density
(g/cm
3
)
Mineral
Grain density
(g/cm
3
)
Quartz
2.65
Halite
a
2.16
Calcite
2.71
Gypsum
a
2.30
Dolomite 2.87
Anhydrite
a 2.96
Biotite
2.90
Carnalite
a
1.61
Chlorite
2.80
Sylvite
a
1.99
Illite
2.66
Polyhalite
a 2.78
Kaolinite 2.594
Glauconite 2.30
Muscovite 2.83
Kainite
2.13
a
Evaporites
16 Well Logging: Principles, Applications and Uncertainties
405
porosity.
• Permeability is estimated from the logarithmicmean T 2 and NMR porosity.
• Empirically derived cutoffs separate the T 2 distribution into areas equal to free-fluid porosity and
irreducible water porosity.
16.5.5.2 Uses of Porosity Logs
The main use of porosity logs is to provide porosity
information. In combination with sonic and density logs,
the important applications are compaction trend and uplift
estimation, overpressure detection, seismic data calibration and synthetic seismogram generation. Furthermore,
the combination of density and neutron logs give the best
ways of identifying lithologies and detecting gas-bearing
zones. Numerous uses of porosity logs are given below:
Porosity Estimation
When using a single porosity log, lithology must be
specified through the choice of a matrix value, to avoid
ambiguity in calculating porosity. Combinations of porosity logs may unravel complex matrix (e.g. quartz, calcite,
dolomite) and fluid (e.g. brine, oil, gas) compositions,
providing a more accurate porosity determination.
Porosity from Neutron Log
The neutron tool is sensitive to the amount of hydrogen
ions in the formation and to a less extent also other
elements. It is assumed that the contribution to the
measurement by elements other than hydrogen is negligible, and that the contribution to the measurement from
hydrogen comes entirely from the fluids fully occupying
the pore space. However, in real rocks, elements other
than hydrogen that exist in the rock matrix do contribute
to the measurement, and hydrogen is also present in the
matrix itself (e.g. bound water in shales). The problem is
partially overcome by calibrating the tool against limestone. Pure limestone saturated with freshwater is used
for calibration because it contains no elements which
contribute significantly to the neutron measurements
other than hydrogen. Therefore, the porosities that are
read by the tool are accurate in limestones containing
freshwater. The porosities that are read by the tool in
other lithologies or with other fluids need to be corrected
by a chart given in Fig. 16.20.
Porosity from Density Log
The bulk density log (ρ log ) measures the combined
effects of the fluid density (ρ fluid ) and the density of
the solid phase (ρ matrix ) and is used to compute density
porosity (ϕ D ) using the following relation:
ϕ D ¼ ρ matrix À ρ log
= ρ matrix À ρ fluid
À
Á
(16.6)
The value of the matrix density taken depends upon
the lithology of the target zone. The most common
reservoir rocks are sandstone (ρ matrix ¼ 2.65 g/cm
3 ),
limestone (ρ matrix ¼ 2.71 g/cm
3 ) and dolomite
(ρ matrix ¼ 2.87 g/cm
3 ). Clay minerals have varied
grain densities (Table 16.5). The input of fluid density
(ρ fluid ) is usually that of formation brine (1.025 g/cm
3 ).
The porosity may also be in error if the fluid density
Fig. 16.20 Correction chart for obtaining porosity values for
lithologies other than limestone (re-drawn, courtesy of
Schlumberger)
Table 16.5 Grain (matrix) densities of some common rockforming minerals
Mineral
Grain density
(g/cm
3
)
Mineral
Grain density
(g/cm
3
)
Quartz
2.65
Halite
a
2.16
Calcite
2.71
Gypsum
a
2.30
Dolomite 2.87
Anhydrite
a 2.96
Biotite
2.90
Carnalite
a
1.61
Chlorite
2.80
Sylvite
a
1.99
Illite
2.66
Polyhalite
a 2.78
Kaolinite 2.594
Glauconite 2.30
Muscovite 2.83
Kainite
2.13
a
Evaporites
16 Well Logging: Principles, Applications and Uncertainties
405