

porosity. The log record is usually presented as the
Δt which is the inverse of velocity (i.e. slowness). This
is called interval transit time, and is presented on the
logs on a scale of 40–140 μs/ft (μs ¼ 10
À6 s) or μs/m.
100 μs/ft corresponds to 10,000 ft/s, or 3,048 m/s. The
interval transit time (t) is the reciprocal of the sonic
transit velocity (v).
Since the velocity of sound in water, which here
means porewater, is considerably lower than it is in
minerals and rocks, the measured velocity will be
more or less inversely proportional to the rock porosity.
In sandstones a small amount of cement (i.e. quartz
cement) may produce a grain framework with high
stiffness and velocity despite it retaining a relatively
high porosity. In mudstones and shales the porosity and
velocity vary greatly as a function of the clay mineralogy and the presence of carbonate or quartz cement.
Nuclear Magnetic Resonance (NMR)
NMR logging exploits the large magnetic moment of
hydrogen, an element which is abundant in rocks in the
form of water. The NMR signal amplitude is proportional to the quantity of hydrogen nuclei present in a
formation and can be calibrated to give a value for
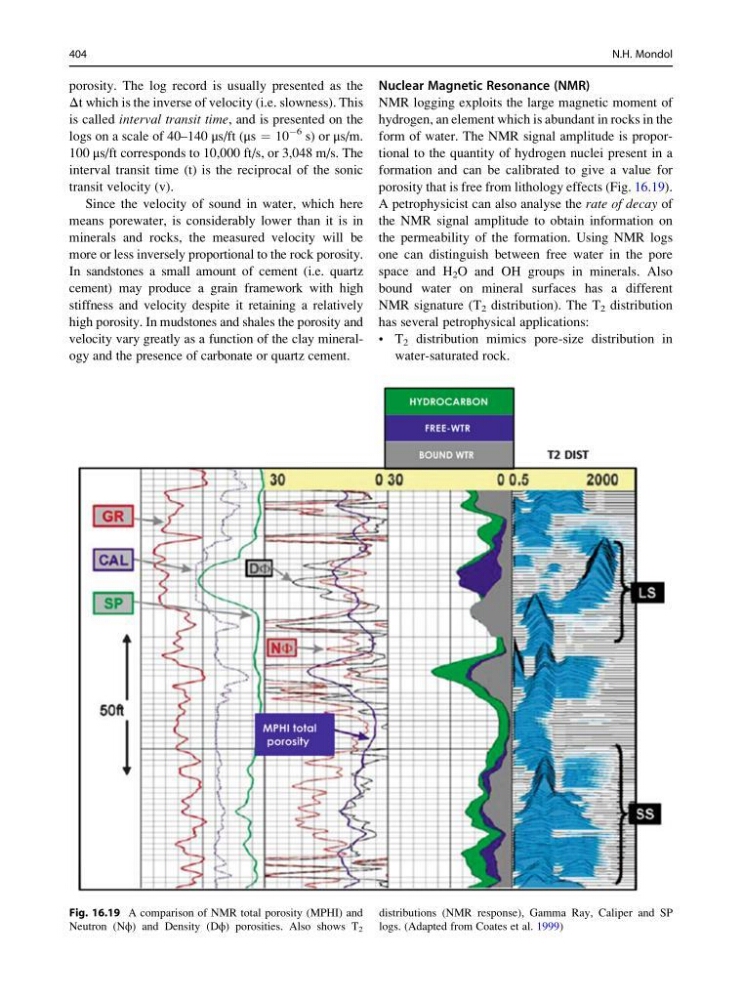
porosity that is free from lithology effects (Fig. 16.19).
A petrophysicist can also analyse the rate of decay of
the NMR signal amplitude to obtain information on
the permeability of the formation. Using NMR logs
one can distinguish between free water in the pore
space and H 2 O and OH groups in minerals. Also
bound water on mineral surfaces has a different
NMR signature (T 2 distribution). The T 2 distribution
has several petrophysical applications:
• T 2 distribution mimics pore-size distribution in
water-saturated rock.
Fig. 16.19 A comparison of NMR total porosity (MPHI) and
Neutron (Nϕ) and Density (Dϕ) porosities. Also shows T 2
distributions (NMR response), Gamma Ray, Caliper and SP
logs. (Adapted from Coates et al. 1999)
404
N.H. Mondol
Δt which is the inverse of velocity (i.e. slowness). This
is called interval transit time, and is presented on the
logs on a scale of 40–140 μs/ft (μs ¼ 10
À6 s) or μs/m.
100 μs/ft corresponds to 10,000 ft/s, or 3,048 m/s. The
interval transit time (t) is the reciprocal of the sonic
transit velocity (v).
Since the velocity of sound in water, which here
means porewater, is considerably lower than it is in
minerals and rocks, the measured velocity will be
more or less inversely proportional to the rock porosity.
In sandstones a small amount of cement (i.e. quartz
cement) may produce a grain framework with high
stiffness and velocity despite it retaining a relatively
high porosity. In mudstones and shales the porosity and
velocity vary greatly as a function of the clay mineralogy and the presence of carbonate or quartz cement.
Nuclear Magnetic Resonance (NMR)
NMR logging exploits the large magnetic moment of
hydrogen, an element which is abundant in rocks in the
form of water. The NMR signal amplitude is proportional to the quantity of hydrogen nuclei present in a
formation and can be calibrated to give a value for
porosity that is free from lithology effects (Fig. 16.19).
A petrophysicist can also analyse the rate of decay of
the NMR signal amplitude to obtain information on
the permeability of the formation. Using NMR logs
one can distinguish between free water in the pore
space and H 2 O and OH groups in minerals. Also
bound water on mineral surfaces has a different
NMR signature (T 2 distribution). The T 2 distribution
has several petrophysical applications:
• T 2 distribution mimics pore-size distribution in
water-saturated rock.
Fig. 16.19 A comparison of NMR total porosity (MPHI) and
Neutron (Nϕ) and Density (Dϕ) porosities. Also shows T 2
distributions (NMR response), Gamma Ray, Caliper and SP
logs. (Adapted from Coates et al. 1999)
404
N.H. Mondol