

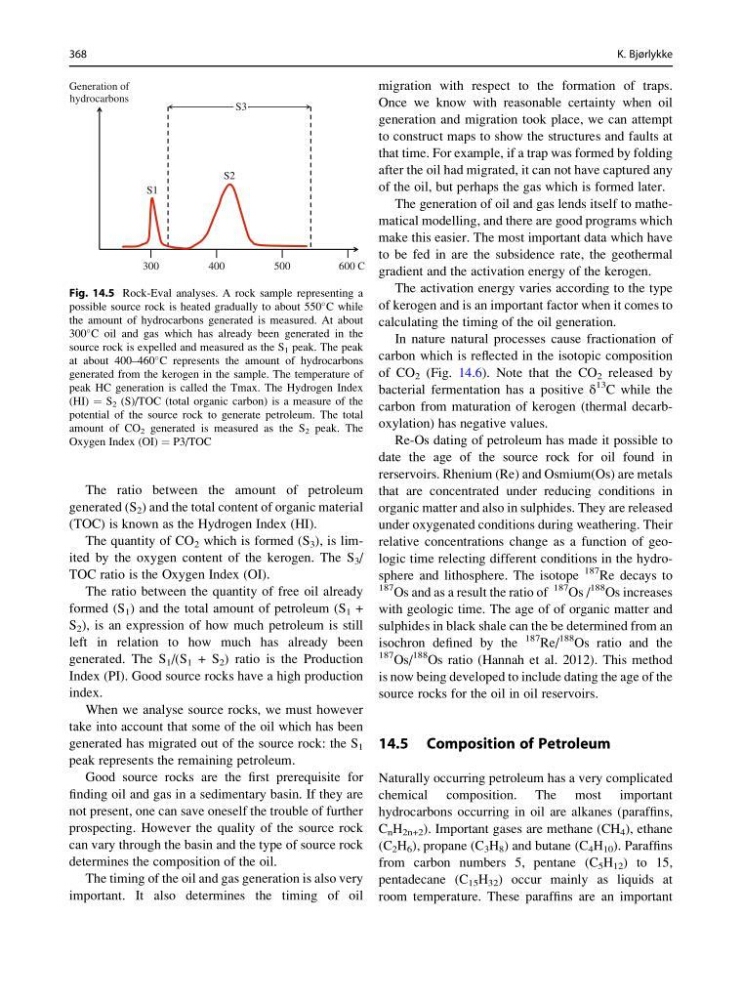
The ratio between the amount of petroleum
generated (S 2 ) and the total content of organic material
(TOC) is known as the Hydrogen Index (HI).
The quantity of CO 2 which is formed (S 3 ), is limited by the oxygen content of the kerogen. The S 3 /
TOC ratio is the Oxygen Index (OI).
The ratio between the quantity of free oil already
formed (S 1 ) and the total amount of petroleum (S 1 +
S 2 ), is an expression of how much petroleum is still
left in relation to how much has already been
generated. The S 1 /(S 1 + S 2 ) ratio is the Production
Index (PI). Good source rocks have a high production
index.
When we analyse source rocks, we must however
take into account that some of the oil which has been
generated has migrated out of the source rock: the S 1
peak represents the remaining petroleum.
Good source rocks are the first prerequisite for
finding oil and gas in a sedimentary basin. If they are
not present, one can save oneself the trouble of further
prospecting. However the quality of the source rock
can vary through the basin and the type of source rock
determines the composition of the oil.
The timing of the oil and gas generation is also very
important. It also determines the timing of oil
migration with respect to the formation of traps.
Once we know with reasonable certainty when oil
generation and migration took place, we can attempt
to construct maps to show the structures and faults at
that time. For example, if a trap was formed by folding
after the oil had migrated, it can not have captured any
of the oil, but perhaps the gas which is formed later.
The generation of oil and gas lends itself to mathematical modelling, and there are good programs which
make this easier. The most important data which have
to be fed in are the subsidence rate, the geothermal
gradient and the activation energy of the kerogen.
The activation energy varies according to the type
of kerogen and is an important factor when it comes to
calculating the timing of the oil generation.
In nature natural processes cause fractionation of
carbon which is reflected in the isotopic composition
of CO 2 (Fig. 14.6). Note that the CO 2 released by
bacterial fermentation has a positive δ
13
C while the
carbon from maturation of kerogen (thermal decarboxylation) has negative values.
Re-Os dating of petroleum has made it possible to
date the age of the source rock for oil found in
rerservoirs. Rhenium (Re) and Osmium(Os) are metals
that are concentrated under reducing conditions in
organic matter and also in sulphides. They are released
under oxygenated conditions during weathering. Their
relative concentrations change as a function of geologic time relecting different conditions in the hydrosphere and lithosphere. The isotope
187 Re decays to
187 Os and as a result the ratio of
187
Os /
188 Os increases
with geologic time. The age of of organic matter and
sulphides in black shale can the be determined from an
isochron defined by the
187 Re/
188 Os ratio and the
187 Os/
188 Os ratio (Hannah et al. 2012). This method
is now being developed to include dating the age of the
source rocks for the oil in oil reservoirs.
14.5 Composition of Petroleum
Naturally occurring petroleum has a very complicated
chemical composition. The most important
hydrocarbons occurring in oil are alkanes (paraffins,
C n H 2n+2 ). Important gases are methane (CH 4 ), ethane
(C 2 H 6 ), propane (C 3 H 8 ) and butane (C 4 H 10 ). Paraffins
from carbon numbers 5, pentane (C 5 H 12 ) to 15,
pentadecane (C 15 H 32 ) occur mainly as liquids at
room temperature. These paraffins are an important
300
400
500
600 C
S2
S1
S3
Generation of
hydrocarbons
Fig. 14.5 Rock-Eval analyses. A rock sample representing a
possible source rock is heated gradually to about 550
C while
the amount of hydrocarbons generated is measured. At about
300
C oil and gas which has already been generated in the
source rock is expelled and measured as the S 1 peak. The peak
at about 400–460
C represents the amount of hydrocarbons
generated from the kerogen in the sample. The temperature of
peak HC generation is called the Tmax. The Hydrogen Index
(HI) ¼ S 2 (S)/TOC (total organic carbon) is a measure of the
potential of the source rock to generate petroleum. The total
amount of CO 2 generated is measured as the S 2 peak. The
Oxygen Index (OI) ¼ P3/TOC
368
K. Bjørlykke
generated (S 2 ) and the total content of organic material
(TOC) is known as the Hydrogen Index (HI).
The quantity of CO 2 which is formed (S 3 ), is limited by the oxygen content of the kerogen. The S 3 /
TOC ratio is the Oxygen Index (OI).
The ratio between the quantity of free oil already
formed (S 1 ) and the total amount of petroleum (S 1 +
S 2 ), is an expression of how much petroleum is still
left in relation to how much has already been
generated. The S 1 /(S 1 + S 2 ) ratio is the Production
Index (PI). Good source rocks have a high production
index.
When we analyse source rocks, we must however
take into account that some of the oil which has been
generated has migrated out of the source rock: the S 1
peak represents the remaining petroleum.
Good source rocks are the first prerequisite for
finding oil and gas in a sedimentary basin. If they are
not present, one can save oneself the trouble of further
prospecting. However the quality of the source rock
can vary through the basin and the type of source rock
determines the composition of the oil.
The timing of the oil and gas generation is also very
important. It also determines the timing of oil
migration with respect to the formation of traps.
Once we know with reasonable certainty when oil
generation and migration took place, we can attempt
to construct maps to show the structures and faults at
that time. For example, if a trap was formed by folding
after the oil had migrated, it can not have captured any
of the oil, but perhaps the gas which is formed later.
The generation of oil and gas lends itself to mathematical modelling, and there are good programs which
make this easier. The most important data which have
to be fed in are the subsidence rate, the geothermal
gradient and the activation energy of the kerogen.
The activation energy varies according to the type
of kerogen and is an important factor when it comes to
calculating the timing of the oil generation.
In nature natural processes cause fractionation of
carbon which is reflected in the isotopic composition
of CO 2 (Fig. 14.6). Note that the CO 2 released by
bacterial fermentation has a positive δ
13
C while the
carbon from maturation of kerogen (thermal decarboxylation) has negative values.
Re-Os dating of petroleum has made it possible to
date the age of the source rock for oil found in
rerservoirs. Rhenium (Re) and Osmium(Os) are metals
that are concentrated under reducing conditions in
organic matter and also in sulphides. They are released
under oxygenated conditions during weathering. Their
relative concentrations change as a function of geologic time relecting different conditions in the hydrosphere and lithosphere. The isotope
187 Re decays to
187 Os and as a result the ratio of
187
Os /
188 Os increases
with geologic time. The age of of organic matter and
sulphides in black shale can the be determined from an
isochron defined by the
187 Re/
188 Os ratio and the
187 Os/
188 Os ratio (Hannah et al. 2012). This method
is now being developed to include dating the age of the
source rocks for the oil in oil reservoirs.
14.5 Composition of Petroleum
Naturally occurring petroleum has a very complicated
chemical composition. The most important
hydrocarbons occurring in oil are alkanes (paraffins,
C n H 2n+2 ). Important gases are methane (CH 4 ), ethane
(C 2 H 6 ), propane (C 3 H 8 ) and butane (C 4 H 10 ). Paraffins
from carbon numbers 5, pentane (C 5 H 12 ) to 15,
pentadecane (C 15 H 32 ) occur mainly as liquids at
room temperature. These paraffins are an important
300
400
500
600 C
S2
S1
S3
Generation of
hydrocarbons
Fig. 14.5 Rock-Eval analyses. A rock sample representing a
possible source rock is heated gradually to about 550
C while
the amount of hydrocarbons generated is measured. At about
300
C oil and gas which has already been generated in the
source rock is expelled and measured as the S 1 peak. The peak
at about 400–460
C represents the amount of hydrocarbons
generated from the kerogen in the sample. The temperature of
peak HC generation is called the Tmax. The Hydrogen Index
(HI) ¼ S 2 (S)/TOC (total organic carbon) is a measure of the
potential of the source rock to generate petroleum. The total
amount of CO 2 generated is measured as the S 2 peak. The
Oxygen Index (OI) ¼ P3/TOC
368
K. Bjørlykke