

The rate of sediment heating, i.e. temperature
increase per unit time, can be expressed as dT/dt.
The rate of subsidence is dZ/dt, and the geometrical
gradient dT/dZ. We then get:
Rate of heating dT=dt
ð
Þ¼rate of subsidence
dZ=dt
ð
ÞÁgeothermal gradient dT=dZ
ð
Þ:
In basins like the North Sea the rate of heating is
typically only 1–2
C/million years but during rapid
subsidence and sedimentation in the late Cenozoic
the heating rate was higher. During the deposition of
1–1.5 km of upper Pliocene and Pleistocene sediment
in 2–3 million years, the gradient was lowered but the
heating rate must have been about 10
C/million years.
The maturity of source rocks can now be calculated
with the help of basin modelling integrating temperature over time. The subsidence curve for the source
rock is determined from the stratigraphic age and
thickness of the overlying sequence.
By estimating a geothermal gradient, depth can be
converted to temperature. This way we obtain a curve
that shows the temperature history of the kerogen
through geological time. Integration of this curve
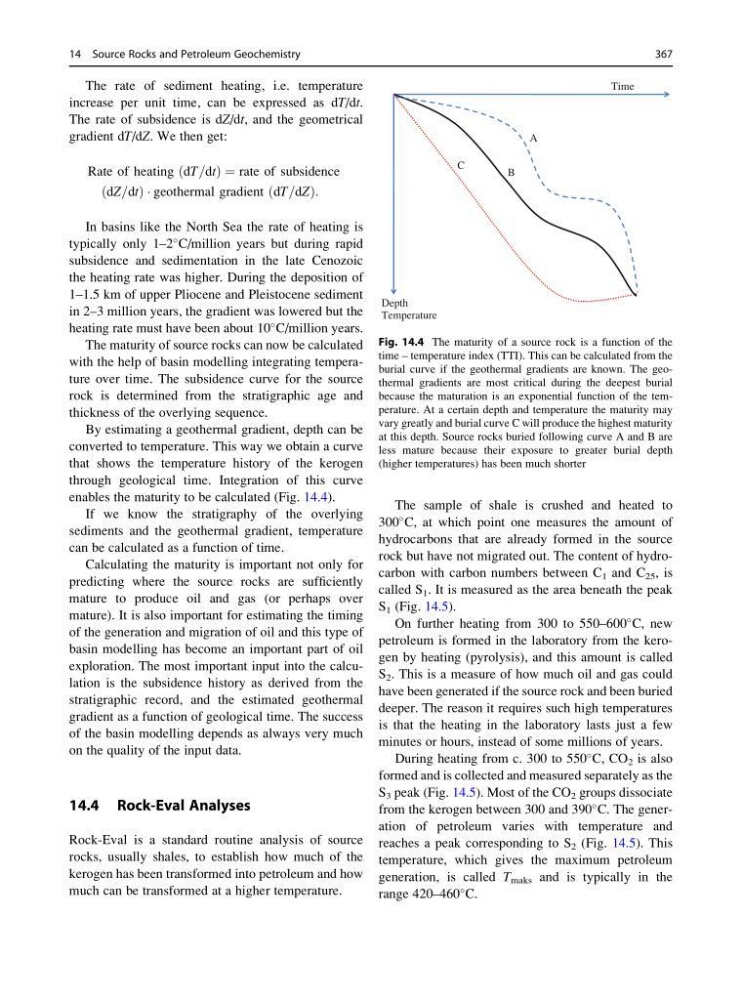
enables the maturity to be calculated (Fig. 14.4).
If we know the stratigraphy of the overlying
sediments and the geothermal gradient, temperature
can be calculated as a function of time.
Calculating the maturity is important not only for
predicting where the source rocks are sufficiently
mature to produce oil and gas (or perhaps over
mature). It is also important for estimating the timing
of the generation and migration of oil and this type of
basin modelling has become an important part of oil
exploration. The most important input into the calculation is the subsidence history as derived from the
stratigraphic record, and the estimated geothermal
gradient as a function of geological time. The success
of the basin modelling depends as always very much
on the quality of the input data.
14.4 Rock-Eval Analyses
Rock-Eval is a standard routine analysis of source
rocks, usually shales, to establish how much of the
kerogen has been transformed into petroleum and how
much can be transformed at a higher temperature.
The sample of shale is crushed and heated to
300
C, at which point one measures the amount of
hydrocarbons that are already formed in the source
rock but have not migrated out. The content of hydrocarbon with carbon numbers between C 1 and C 25 , is
called S 1 . It is measured as the area beneath the peak
S 1 (Fig. 14.5).
On further heating from 300 to 550–600
C, new
petroleum is formed in the laboratory from the kerogen by heating (pyrolysis), and this amount is called
S 2 . This is a measure of how much oil and gas could
have been generated if the source rock and been buried
deeper. The reason it requires such high temperatures
is that the heating in the laboratory lasts just a few
minutes or hours, instead of some millions of years.
During heating from c. 300 to 550
C, CO 2 is also
formed and is collected and measured separately as the
S 3 peak (Fig. 14.5). Most of the CO 2 groups dissociate
from the kerogen between 300 and 390
C. The generation of petroleum varies with temperature and
reaches a peak corresponding to S 2 (Fig. 14.5). This
temperature, which gives the maximum petroleum
generation, is called T maks and is typically in the
range 420–460
C.
A
B
Time
Depth
Temperature
C
Fig. 14.4 The maturity of a source rock is a function of the
time – temperature index (TTI). This can be calculated from the
burial curve if the geothermal gradients are known. The geothermal gradients are most critical during the deepest burial
because the maturation is an exponential function of the temperature. At a certain depth and temperature the maturity may
vary greatly and burial curve C will produce the highest maturity
at this depth. Source rocks buried following curve A and B are
less mature because their exposure to greater burial depth
(higher temperatures) has been much shorter
14 Source Rocks and Petroleum Geochemistry
367
increase per unit time, can be expressed as dT/dt.
The rate of subsidence is dZ/dt, and the geometrical
gradient dT/dZ. We then get:
Rate of heating dT=dt
ð
Þ¼rate of subsidence
dZ=dt
ð
ÞÁgeothermal gradient dT=dZ
ð
Þ:
In basins like the North Sea the rate of heating is
typically only 1–2
C/million years but during rapid
subsidence and sedimentation in the late Cenozoic
the heating rate was higher. During the deposition of
1–1.5 km of upper Pliocene and Pleistocene sediment
in 2–3 million years, the gradient was lowered but the
heating rate must have been about 10
C/million years.
The maturity of source rocks can now be calculated
with the help of basin modelling integrating temperature over time. The subsidence curve for the source
rock is determined from the stratigraphic age and
thickness of the overlying sequence.
By estimating a geothermal gradient, depth can be
converted to temperature. This way we obtain a curve
that shows the temperature history of the kerogen
through geological time. Integration of this curve
enables the maturity to be calculated (Fig. 14.4).
If we know the stratigraphy of the overlying
sediments and the geothermal gradient, temperature
can be calculated as a function of time.
Calculating the maturity is important not only for
predicting where the source rocks are sufficiently
mature to produce oil and gas (or perhaps over
mature). It is also important for estimating the timing
of the generation and migration of oil and this type of
basin modelling has become an important part of oil
exploration. The most important input into the calculation is the subsidence history as derived from the
stratigraphic record, and the estimated geothermal
gradient as a function of geological time. The success
of the basin modelling depends as always very much
on the quality of the input data.
14.4 Rock-Eval Analyses
Rock-Eval is a standard routine analysis of source
rocks, usually shales, to establish how much of the
kerogen has been transformed into petroleum and how
much can be transformed at a higher temperature.
The sample of shale is crushed and heated to
300
C, at which point one measures the amount of
hydrocarbons that are already formed in the source
rock but have not migrated out. The content of hydrocarbon with carbon numbers between C 1 and C 25 , is
called S 1 . It is measured as the area beneath the peak
S 1 (Fig. 14.5).
On further heating from 300 to 550–600
C, new
petroleum is formed in the laboratory from the kerogen by heating (pyrolysis), and this amount is called
S 2 . This is a measure of how much oil and gas could
have been generated if the source rock and been buried
deeper. The reason it requires such high temperatures
is that the heating in the laboratory lasts just a few
minutes or hours, instead of some millions of years.
During heating from c. 300 to 550
C, CO 2 is also
formed and is collected and measured separately as the
S 3 peak (Fig. 14.5). Most of the CO 2 groups dissociate
from the kerogen between 300 and 390
C. The generation of petroleum varies with temperature and
reaches a peak corresponding to S 2 (Fig. 14.5). This
temperature, which gives the maximum petroleum
generation, is called T maks and is typically in the
range 420–460
C.
A
B
Time
Depth
Temperature
C
Fig. 14.4 The maturity of a source rock is a function of the
time – temperature index (TTI). This can be calculated from the
burial curve if the geothermal gradients are known. The geothermal gradients are most critical during the deepest burial
because the maturation is an exponential function of the temperature. At a certain depth and temperature the maturity may
vary greatly and burial curve C will produce the highest maturity
at this depth. Source rocks buried following curve A and B are
less mature because their exposure to greater burial depth
(higher temperatures) has been much shorter
14 Source Rocks and Petroleum Geochemistry
367