

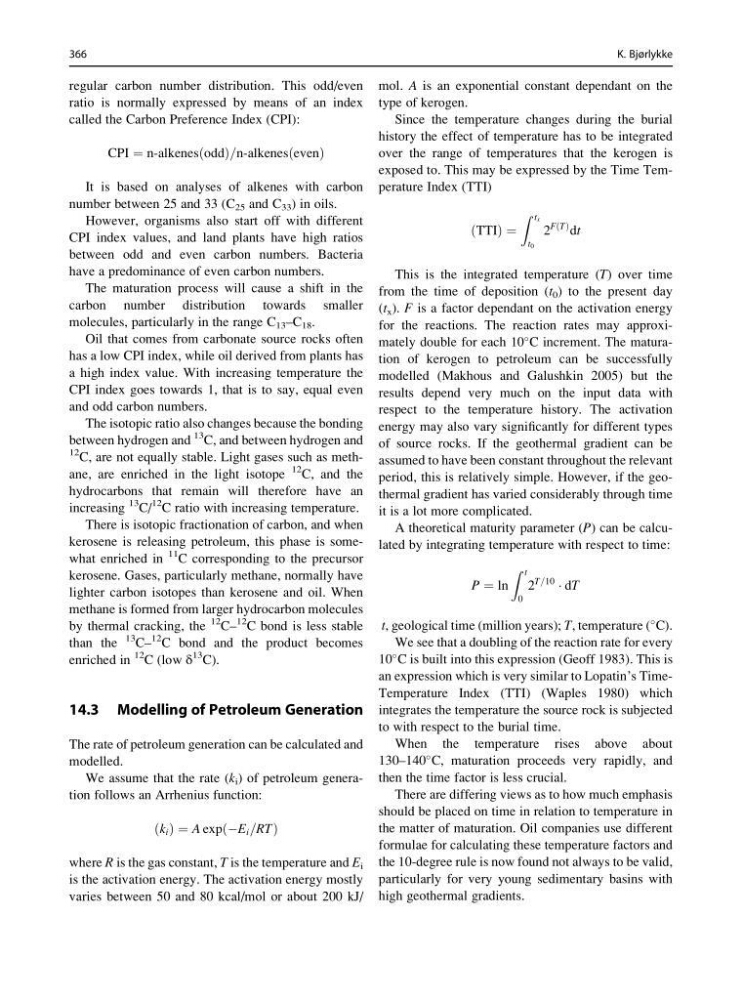
regular carbon number distribution. This odd/even
ratio is normally expressed by means of an index
called the Carbon Preference Index (CPI):
CPI ¼ n-alkenes odd
ð
Þ=n-alkenes even
ð
Þ
It is based on analyses of alkenes with carbon
number between 25 and 33 (C 25 and C 33 ) in oils.
However, organisms also start off with different
CPI index values, and land plants have high ratios
between odd and even carbon numbers. Bacteria
have a predominance of even carbon numbers.
The maturation process will cause a shift in the
carbon number distribution towards smaller
molecules, particularly in the range C 13 –C 18 .
Oil that comes from carbonate source rocks often
has a low CPI index, while oil derived from plants has
a high index value. With increasing temperature the
CPI index goes towards 1, that is to say, equal even
and odd carbon numbers.
The isotopic ratio also changes because the bonding
between hydrogen and
13 C, and between hydrogen and
12 C, are not equally stable. Light gases such as methane, are enriched in the light isotope
12 C, and the
hydrocarbons that remain will therefore have an
increasing
13 C/
12 C ratio with increasing temperature.
There is isotopic fractionation of carbon, and when
kerosene is releasing petroleum, this phase is somewhat enriched in
11 C corresponding to the precursor
kerosene. Gases, particularly methane, normally have
lighter carbon isotopes than kerosene and oil. When
methane is formed from larger hydrocarbon molecules
by thermal cracking, the
12 C–
12 C bond is less stable
than the
13 C–
12 C bond and the product becomes
enriched in
12 C (low δ
13 C).
14.3 Modelling of Petroleum Generation
The rate of petroleum generation can be calculated and
modelled.
We assume that the rate (k i ) of petroleum generation follows an Arrhenius function:
k i
ð Þ ¼ A exp ÀE i =RT
ð
Þ
where R is the gas constant, T is the temperature and E i
is the activation energy. The activation energy mostly
varies between 50 and 80 kcal/mol or about 200 kJ/
mol. A is an exponential constant dependant on the
type of kerogen.
Since the temperature changes during the burial
history the effect of temperature has to be integrated
over the range of temperatures that the kerogen is
exposed to. This may be expressed by the Time Temperature Index (TTI)
TTI
ð
Þ ¼
Z t x
t 0
2
F T
ð Þ dt
This is the integrated temperature (T) over time
from the time of deposition (t 0 ) to the present day
(t x ). F is a factor dependant on the activation energy
for the reactions. The reaction rates may approximately double for each 10
C increment. The maturation of kerogen to petroleum can be successfully
modelled (Makhous and Galushkin 2005) but the
results depend very much on the input data with
respect to the temperature history. The activation
energy may also vary significantly for different types
of source rocks. If the geothermal gradient can be
assumed to have been constant throughout the relevant
period, this is relatively simple. However, if the geothermal gradient has varied considerably through time
it is a lot more complicated.
A theoretical maturity parameter (P) can be calculated by integrating temperature with respect to time:
P ¼ ln
Z t
0
2
T=10
Á dT
t, geological time (million years); T, temperature (
C).
We see that a doubling of the reaction rate for every
10
C is built into this expression (Geoff 1983). This is
an expression which is very similar to Lopatin’s TimeTemperature Index (TTI) (Waples 1980) which
integrates the temperature the source rock is subjected
to with respect to the burial time.
When the temperature rises above about
130–140
C, maturation proceeds very rapidly, and
then the time factor is less crucial.
There are differing views as to how much emphasis
should be placed on time in relation to temperature in
the matter of maturation. Oil companies use different
formulae for calculating these temperature factors and
the 10-degree rule is now found not always to be valid,
particularly for very young sedimentary basins with
high geothermal gradients.
366
K. Bjørlykke
ratio is normally expressed by means of an index
called the Carbon Preference Index (CPI):
CPI ¼ n-alkenes odd
ð
Þ=n-alkenes even
ð
Þ
It is based on analyses of alkenes with carbon
number between 25 and 33 (C 25 and C 33 ) in oils.
However, organisms also start off with different
CPI index values, and land plants have high ratios
between odd and even carbon numbers. Bacteria
have a predominance of even carbon numbers.
The maturation process will cause a shift in the
carbon number distribution towards smaller
molecules, particularly in the range C 13 –C 18 .
Oil that comes from carbonate source rocks often
has a low CPI index, while oil derived from plants has
a high index value. With increasing temperature the
CPI index goes towards 1, that is to say, equal even
and odd carbon numbers.
The isotopic ratio also changes because the bonding
between hydrogen and
13 C, and between hydrogen and
12 C, are not equally stable. Light gases such as methane, are enriched in the light isotope
12 C, and the
hydrocarbons that remain will therefore have an
increasing
13 C/
12 C ratio with increasing temperature.
There is isotopic fractionation of carbon, and when
kerosene is releasing petroleum, this phase is somewhat enriched in
11 C corresponding to the precursor
kerosene. Gases, particularly methane, normally have
lighter carbon isotopes than kerosene and oil. When
methane is formed from larger hydrocarbon molecules
by thermal cracking, the
12 C–
12 C bond is less stable
than the
13 C–
12 C bond and the product becomes
enriched in
12 C (low δ
13 C).
14.3 Modelling of Petroleum Generation
The rate of petroleum generation can be calculated and
modelled.
We assume that the rate (k i ) of petroleum generation follows an Arrhenius function:
k i
ð Þ ¼ A exp ÀE i =RT
ð
Þ
where R is the gas constant, T is the temperature and E i
is the activation energy. The activation energy mostly
varies between 50 and 80 kcal/mol or about 200 kJ/
mol. A is an exponential constant dependant on the
type of kerogen.
Since the temperature changes during the burial
history the effect of temperature has to be integrated
over the range of temperatures that the kerogen is
exposed to. This may be expressed by the Time Temperature Index (TTI)
TTI
ð
Þ ¼
Z t x
t 0
2
F T
ð Þ dt
This is the integrated temperature (T) over time
from the time of deposition (t 0 ) to the present day
(t x ). F is a factor dependant on the activation energy
for the reactions. The reaction rates may approximately double for each 10
C increment. The maturation of kerogen to petroleum can be successfully
modelled (Makhous and Galushkin 2005) but the
results depend very much on the input data with
respect to the temperature history. The activation
energy may also vary significantly for different types
of source rocks. If the geothermal gradient can be
assumed to have been constant throughout the relevant
period, this is relatively simple. However, if the geothermal gradient has varied considerably through time
it is a lot more complicated.
A theoretical maturity parameter (P) can be calculated by integrating temperature with respect to time:
P ¼ ln
Z t
0
2
T=10
Á dT
t, geological time (million years); T, temperature (
C).
We see that a doubling of the reaction rate for every
10
C is built into this expression (Geoff 1983). This is
an expression which is very similar to Lopatin’s TimeTemperature Index (TTI) (Waples 1980) which
integrates the temperature the source rock is subjected
to with respect to the burial time.
When the temperature rises above about
130–140
C, maturation proceeds very rapidly, and
then the time factor is less crucial.
There are differing views as to how much emphasis
should be placed on time in relation to temperature in
the matter of maturation. Oil companies use different
formulae for calculating these temperature factors and
the 10-degree rule is now found not always to be valid,
particularly for very young sedimentary basins with
high geothermal gradients.
366
K. Bjørlykke