

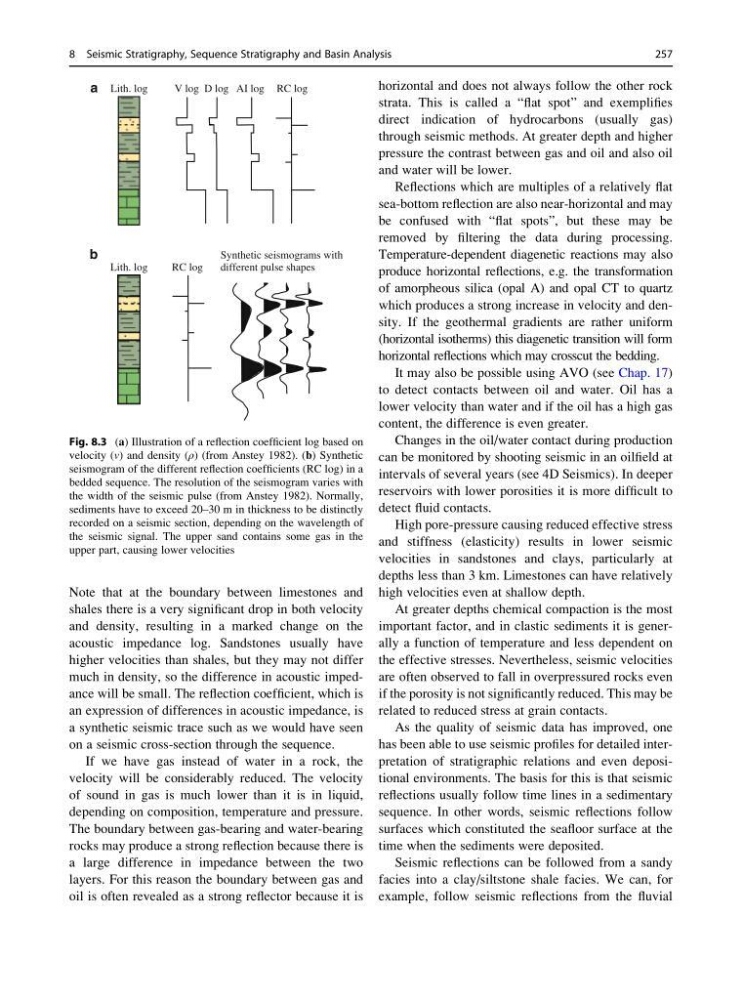
Note that at the boundary between limestones and
shales there is a very significant drop in both velocity
and density, resulting in a marked change on the
acoustic impedance log. Sandstones usually have
higher velocities than shales, but they may not differ
much in density, so the difference in acoustic impedance will be small. The reflection coefficient, which is
an expression of differences in acoustic impedance, is
a synthetic seismic trace such as we would have seen
on a seismic cross-section through the sequence.
If we have gas instead of water in a rock, the
velocity will be considerably reduced. The velocity
of sound in gas is much lower than it is in liquid,
depending on composition, temperature and pressure.
The boundary between gas-bearing and water-bearing
rocks may produce a strong reflection because there is
a large difference in impedance between the two
layers. For this reason the boundary between gas and
oil is often revealed as a strong reflector because it is
horizontal and does not always follow the other rock
strata. This is called a “flat spot” and exemplifies
direct indication of hydrocarbons (usually gas)
through seismic methods. At greater depth and higher
pressure the contrast between gas and oil and also oil
and water will be lower.
Reflections which are multiples of a relatively flat
sea-bottom reflection are also near-horizontal and may
be confused with “flat spots”, but these may be
removed by filtering the data during processing.
Temperature-dependent diagenetic reactions may also
produce horizontal reflections, e.g. the transformation
of amorpheous silica (opal A) and opal CT to quartz
which produces a strong increase in velocity and density. If the geothermal gradients are rather uniform
(horizontal isotherms) this diagenetic transition will form
horizontal reflections which may crosscut the bedding.
It may also be possible using AVO (see Chap. 17)
to detect contacts between oil and water. Oil has a
lower velocity than water and if the oil has a high gas
content, the difference is even greater.
Changes in the oil/water contact during production
can be monitored by shooting seismic in an oilfield at
intervals of several years (see 4D Seismics). In deeper
reservoirs with lower porosities it is more difficult to
detect fluid contacts.
High pore-pressure causing reduced effective stress
and stiffness (elasticity) results in lower seismic
velocities in sandstones and clays, particularly at
depths less than 3 km. Limestones can have relatively
high velocities even at shallow depth.
At greater depths chemical compaction is the most
important factor, and in clastic sediments it is generally a function of temperature and less dependent on
the effective stresses. Nevertheless, seismic velocities
are often observed to fall in overpressured rocks even
if the porosity is not significantly reduced. This may be
related to reduced stress at grain contacts.
As the quality of seismic data has improved, one
has been able to use seismic profiles for detailed interpretation of stratigraphic relations and even depositional environments. The basis for this is that seismic
reflections usually follow time lines in a sedimentary
sequence. In other words, seismic reflections follow
surfaces which constituted the seafloor surface at the
time when the sediments were deposited.
Seismic reflections can be followed from a sandy
facies into a clay/siltstone shale facies. We can, for
example, follow seismic reflections from the fluvial
Lith. log
a
b
Lith. log
Synthetic seismograms with
different pulse shapes
RC log
AI log
D log
V log
RC log
Fig. 8.3 (a) Illustration of a reflection coefficient log based on
velocity (v) and density (ρ) (from Anstey 1982). (b) Synthetic
seismogram of the different reflection coefficients (RC log) in a
bedded sequence. The resolution of the seismogram varies with
the width of the seismic pulse (from Anstey 1982). Normally,
sediments have to exceed 20–30 m in thickness to be distinctly
recorded on a seismic section, depending on the wavelength of
the seismic signal. The upper sand contains some gas in the
upper part, causing lower velocities
8 Seismic Stratigraphy, Sequence Stratigraphy and Basin Analysis
257
shales there is a very significant drop in both velocity
and density, resulting in a marked change on the
acoustic impedance log. Sandstones usually have
higher velocities than shales, but they may not differ
much in density, so the difference in acoustic impedance will be small. The reflection coefficient, which is
an expression of differences in acoustic impedance, is
a synthetic seismic trace such as we would have seen
on a seismic cross-section through the sequence.
If we have gas instead of water in a rock, the
velocity will be considerably reduced. The velocity
of sound in gas is much lower than it is in liquid,
depending on composition, temperature and pressure.
The boundary between gas-bearing and water-bearing
rocks may produce a strong reflection because there is
a large difference in impedance between the two
layers. For this reason the boundary between gas and
oil is often revealed as a strong reflector because it is
horizontal and does not always follow the other rock
strata. This is called a “flat spot” and exemplifies
direct indication of hydrocarbons (usually gas)
through seismic methods. At greater depth and higher
pressure the contrast between gas and oil and also oil
and water will be lower.
Reflections which are multiples of a relatively flat
sea-bottom reflection are also near-horizontal and may
be confused with “flat spots”, but these may be
removed by filtering the data during processing.
Temperature-dependent diagenetic reactions may also
produce horizontal reflections, e.g. the transformation
of amorpheous silica (opal A) and opal CT to quartz
which produces a strong increase in velocity and density. If the geothermal gradients are rather uniform
(horizontal isotherms) this diagenetic transition will form
horizontal reflections which may crosscut the bedding.
It may also be possible using AVO (see Chap. 17)
to detect contacts between oil and water. Oil has a
lower velocity than water and if the oil has a high gas
content, the difference is even greater.
Changes in the oil/water contact during production
can be monitored by shooting seismic in an oilfield at
intervals of several years (see 4D Seismics). In deeper
reservoirs with lower porosities it is more difficult to
detect fluid contacts.
High pore-pressure causing reduced effective stress
and stiffness (elasticity) results in lower seismic
velocities in sandstones and clays, particularly at
depths less than 3 km. Limestones can have relatively
high velocities even at shallow depth.
At greater depths chemical compaction is the most
important factor, and in clastic sediments it is generally a function of temperature and less dependent on
the effective stresses. Nevertheless, seismic velocities
are often observed to fall in overpressured rocks even
if the porosity is not significantly reduced. This may be
related to reduced stress at grain contacts.
As the quality of seismic data has improved, one
has been able to use seismic profiles for detailed interpretation of stratigraphic relations and even depositional environments. The basis for this is that seismic
reflections usually follow time lines in a sedimentary
sequence. In other words, seismic reflections follow
surfaces which constituted the seafloor surface at the
time when the sediments were deposited.
Seismic reflections can be followed from a sandy
facies into a clay/siltstone shale facies. We can, for
example, follow seismic reflections from the fluvial
Lith. log
a
b
Lith. log
Synthetic seismograms with
different pulse shapes
RC log
AI log
D log
V log
RC log
Fig. 8.3 (a) Illustration of a reflection coefficient log based on
velocity (v) and density (ρ) (from Anstey 1982). (b) Synthetic
seismogram of the different reflection coefficients (RC log) in a
bedded sequence. The resolution of the seismogram varies with
the width of the seismic pulse (from Anstey 1982). Normally,
sediments have to exceed 20–30 m in thickness to be distinctly
recorded on a seismic section, depending on the wavelength of
the seismic signal. The upper sand contains some gas in the
upper part, causing lower velocities
8 Seismic Stratigraphy, Sequence Stratigraphy and Basin Analysis
257