

Tectonic Control of Alluvial Stratigraphy
I
I
I
I
I �
A
I 'i
I
I� RELATIVE
It:> .RISE OF
! � SEA lEVEL
I a
I
I I;;
I�
18
I
t llll [
NO DIFfERENTIAl. SUBSIDENCE
I
o
'--- --'
l
10 Ml
CO ASTAl ENCRdACHMEN l
�-------------------------UNCONFORMITY TYPES
m AltuVIAt PLAIN 0 NEAI1SI!OIIE
GtDASTAL PlAIN � ft\IE-GRAINW MARINE
EUSTATIC SEA LE\/El
toW
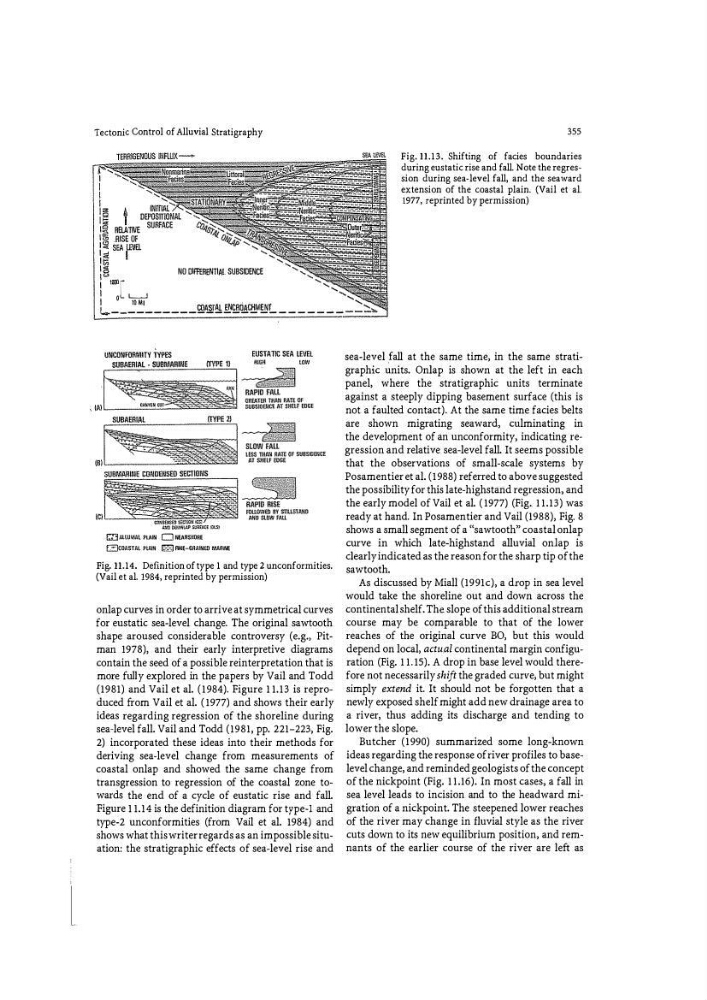
Fig. 11.14. Definition of type 1 and type 2 unconformities.
(Vail et al. 1984, reprinted by permission)
onlap curves in order to arrive at symmetrical curves
for eustatic sea-level change. The original sawtooth
shape aroused considerable controversy (e.g., Pitman 1978), and their early interpretive diagrams
contain the seed of a possible reinterpretation that is
more fully explored in the papers by Vail and Todd
(1981) and Vail et al. (1984). Figure 11.13 is reproduced fr om Vail et al. (1977) and shows their early
ideas regarding regression of the shoreline during
sea-level fall. Vail and Todd (1981, pp. 221-223, Fig.
2) incorporated these ideas into their methods for
deriving sea-level change from measurements of
coastal onlap and showed the same change from
transgression to regression of the coastal zone towards the end of a cycle of eustatic rise and fall.
Figure 11.14 is the definition diagram for type-! and
type-2 unconformities (from Vail et al. 1984) and
shows what this writer regards as an impossible situation: the stratigraphic effects of sea-level rise and
355
Fig. 11.13. Shifting of facies boundaries
during eustatic rise and fall. Note the regression during sea�level fall, and the seaward
extension of the coastal plain. (Vail et al.
1977, reprinted by permission)
sea-level .fall at the same time, in the same stratigraphic units. Onlap is shown at the left in each
panel, where the stratigraphic units terminate
against a steeply dipping basement surface (this is
not a faulted contact). At the same time facies belts
are shown migrating seaward, culminating in
the development of an unconformity, indicating regression and relative sea-level fall. It seems possible
that the observations of small-scale systems by
Posamentier et al. (1988) referred to above suggested
the possibility for this late-highstand regression, and
the early model of Vail et al. (1977) (Fig .. 11.13) was
ready at hand. In Posamentier and Vail (1988), Fig. 8
shows a small segment of a ((sawtooth" coastal onlap
curve in which late-highstand alluvial onlap is
dearly indicated as the reason for the sharp tip of the
sawtooth.
As discussed by Miall (1991c), a drop in sea level
would take the shoreline out and down across the
continental shelf. The slope of this additional stream
course may be comparable to that of the lower
reaches of the original curve BO, but this would
depend on local, actu. al continental margin configuration (Fig. 11.15). A drop in base level would therefore not necessarily shift the graded curve, but might
simply extend it. It should not be fo rgotten that a
newly exposed shelf might add new drainage area to
a river, thus adding its discharge and tending to
lower the slope.
Butcher (1990) summarized some long-known
ideas regarding the response of river profiles to baselevel change, and reminded geologists of the concept
of the nickpoint (Fig. 11.16). In most cases, a fall in
sea level leads to incision and to the headward migration of a nickpoint. The steepened lower reaches
of the river may change in fluvial style as the river
cuts down to its new equilibrium position, and remnants of the earlier course of the river are left as
I
I
I
I
I �
A
I 'i
I
I� RELATIVE
It:> .RISE OF
! � SEA lEVEL
I a
I
I I;;
I�
18
I
t llll [
NO DIFfERENTIAl. SUBSIDENCE
I
o
'--- --'
l
10 Ml
CO ASTAl ENCRdACHMEN l
�-------------------------UNCONFORMITY TYPES
m AltuVIAt PLAIN 0 NEAI1SI!OIIE
GtDASTAL PlAIN � ft\IE-GRAINW MARINE
EUSTATIC SEA LE\/El
toW
Fig. 11.14. Definition of type 1 and type 2 unconformities.
(Vail et al. 1984, reprinted by permission)
onlap curves in order to arrive at symmetrical curves
for eustatic sea-level change. The original sawtooth
shape aroused considerable controversy (e.g., Pitman 1978), and their early interpretive diagrams
contain the seed of a possible reinterpretation that is
more fully explored in the papers by Vail and Todd
(1981) and Vail et al. (1984). Figure 11.13 is reproduced fr om Vail et al. (1977) and shows their early
ideas regarding regression of the shoreline during
sea-level fall. Vail and Todd (1981, pp. 221-223, Fig.
2) incorporated these ideas into their methods for
deriving sea-level change from measurements of
coastal onlap and showed the same change from
transgression to regression of the coastal zone towards the end of a cycle of eustatic rise and fall.
Figure 11.14 is the definition diagram for type-! and
type-2 unconformities (from Vail et al. 1984) and
shows what this writer regards as an impossible situation: the stratigraphic effects of sea-level rise and
355
Fig. 11.13. Shifting of facies boundaries
during eustatic rise and fall. Note the regression during sea�level fall, and the seaward
extension of the coastal plain. (Vail et al.
1977, reprinted by permission)
sea-level .fall at the same time, in the same stratigraphic units. Onlap is shown at the left in each
panel, where the stratigraphic units terminate
against a steeply dipping basement surface (this is
not a faulted contact). At the same time facies belts
are shown migrating seaward, culminating in
the development of an unconformity, indicating regression and relative sea-level fall. It seems possible
that the observations of small-scale systems by
Posamentier et al. (1988) referred to above suggested
the possibility for this late-highstand regression, and
the early model of Vail et al. (1977) (Fig .. 11.13) was
ready at hand. In Posamentier and Vail (1988), Fig. 8
shows a small segment of a ((sawtooth" coastal onlap
curve in which late-highstand alluvial onlap is
dearly indicated as the reason for the sharp tip of the
sawtooth.
As discussed by Miall (1991c), a drop in sea level
would take the shoreline out and down across the
continental shelf. The slope of this additional stream
course may be comparable to that of the lower
reaches of the original curve BO, but this would
depend on local, actu. al continental margin configuration (Fig. 11.15). A drop in base level would therefore not necessarily shift the graded curve, but might
simply extend it. It should not be fo rgotten that a
newly exposed shelf might add new drainage area to
a river, thus adding its discharge and tending to
lower the slope.
Butcher (1990) summarized some long-known
ideas regarding the response of river profiles to baselevel change, and reminded geologists of the concept
of the nickpoint (Fig. 11.16). In most cases, a fall in
sea level leads to incision and to the headward migration of a nickpoint. The steepened lower reaches
of the river may change in fluvial style as the river
cuts down to its new equilibrium position, and remnants of the earlier course of the river are left as