

354
a)
b)
c)
� " """' ' '
Base!evc! 1
� "
""'"' '
� Basetevel 2
Baselevel 2
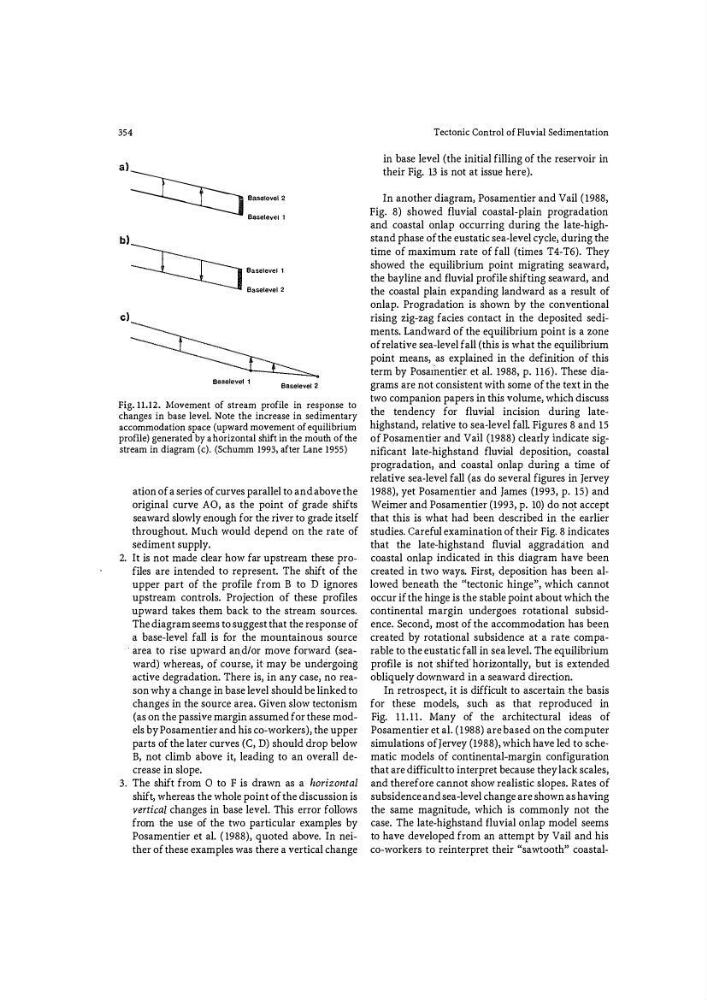
Fig. 11.12. Movement of stream profile in response to
changes in base level. Note the increase in sedimentary
accommodation space (upward movement of equilibrium
profile) generated by a horizontal shift in the mouth of the
stream in diagram (c). (Schumm 1993) after Lane 1955)
ation of a series of curves parallel to and above the
original curve AO, as the point of grade shifts
seaward slowly enough for the river to grade itself
throughout. Much would depend on the rate of
sediment supply.
2. It is not made clear how far upstream these pro�
files are intended to represent. The shift of the
upper part of the profile from B to D ignores
upstream controls. Projection of these profiles
upward takes them back to the stream sources.
The diagram seems to suggest that the response of
a base-level fall is fo r the mountainous source
·a rea to rise upward an.d/or move forward (seaward) whereas, of course,- it may be undergoing
active degradation. There is, in any case, no reason why a change in base level should be linked to
changes in the source area. Given slow tectonism
(as on the passive margin assumed for these models by Posamentier and his co-workers), the upper
parts of the later curves (C, D) should drop below
B, not climb above it, leading to an overall decrease in slope.
3. The shift from 0 to F is drawn as a horizontal
shift, whereas the whole point of the discussion is
vertical changes in base level. This error follows
from the use of the two particular examples by
Posamentier et al. (1988), quoted above. In neither of these examples was there a vertical change
Tectonic Control of Fluvial Sedimentation
in base level (the initial filling of the reservoir in
their Fig. 13 is not at issue here).
In another diagram, Posamentier and Vail (1988,
Fig. 8) showed fluvial coastal-plain progradation
and coastal onlap occurring during the late-highstand phase of the eustatic seaM level cycle, during the
time of maximum rate of fall (times T4-T6). They
showed the equilibrium point migrating seaward,
the bayline and fluvial profile shifting seaward, and
the coastal plain expanding landward as a result of
onlap. Progradation is shown by the conventional
rising zig-zag facies contact in the deposited sediments. Landward of the equilibrium point is a zone
of relative sea-level fall (this is what the equilibrium
point means, as explained in the definition of this
term by Posamentier et al. 1988, p. 116). These diagrams are not consistent with some of the text in the
two companion papers in this volume, which discuss
the tendency for fluvial incision during latehighstand, relative to sea-level fall. Figures 8 and 15
of Posamentier and Vail (1988) clearly indicate significant late-highstand fluvial deposition, coastal
progradation, and coastal onlap during a time of
relative sea-level fall (as do several figures in Jervey
1988), yet Posamentier and james (1993, p. 15) and
Weimer and Posamentier (1993, p. 10) do not accept
that this is what had been described in the earlier
studies. Careful examination of their Fig. 8 indicates
that the late-highstand fluvial aggradation and
coastal onlap indicated in this diagram have been
created in two ways. First, deposition has been al�
lowed beneath the '
continental margin undergoes rotational subsidence. Second, most of the accommodation has been
created by rotational subsidence at a rate comparable to the eustatic fall in sea level. The equilibrium
profile is not ·shifted' ho.rizo;ntally, but is extended
obliquely downward in a seaward direction.
In retrospect, it is difficult to ascertain the basis
for these models, such as that reproduced in
Fig. 11.1!. Many of the architectural ideas of
Posamentier et al. (1988) are based on the computer
simulations ofJervey (1988), which have led to schematic models of continental-margin configuration
that are difficult to interpret because they lack scales,
and therefore cannot show realistic slopes. Rates of
subsidence and sea-level change are shown as having
the same magnitude, which is commonly not the
case. The late-highstand fluvial on!ap model seems
to have developed from an attempt by Vail and his
co-workers to reinterpret their "sawtooth" coastal-
a)
b)
c)
� " """' ' '
Base!evc! 1
� "
""'"' '
� Basetevel 2
Baselevel 2
Fig. 11.12. Movement of stream profile in response to
changes in base level. Note the increase in sedimentary
accommodation space (upward movement of equilibrium
profile) generated by a horizontal shift in the mouth of the
stream in diagram (c). (Schumm 1993) after Lane 1955)
ation of a series of curves parallel to and above the
original curve AO, as the point of grade shifts
seaward slowly enough for the river to grade itself
throughout. Much would depend on the rate of
sediment supply.
2. It is not made clear how far upstream these pro�
files are intended to represent. The shift of the
upper part of the profile from B to D ignores
upstream controls. Projection of these profiles
upward takes them back to the stream sources.
The diagram seems to suggest that the response of
a base-level fall is fo r the mountainous source
·a rea to rise upward an.d/or move forward (seaward) whereas, of course,- it may be undergoing
active degradation. There is, in any case, no reason why a change in base level should be linked to
changes in the source area. Given slow tectonism
(as on the passive margin assumed for these models by Posamentier and his co-workers), the upper
parts of the later curves (C, D) should drop below
B, not climb above it, leading to an overall decrease in slope.
3. The shift from 0 to F is drawn as a horizontal
shift, whereas the whole point of the discussion is
vertical changes in base level. This error follows
from the use of the two particular examples by
Posamentier et al. (1988), quoted above. In neither of these examples was there a vertical change
Tectonic Control of Fluvial Sedimentation
in base level (the initial filling of the reservoir in
their Fig. 13 is not at issue here).
In another diagram, Posamentier and Vail (1988,
Fig. 8) showed fluvial coastal-plain progradation
and coastal onlap occurring during the late-highstand phase of the eustatic seaM level cycle, during the
time of maximum rate of fall (times T4-T6). They
showed the equilibrium point migrating seaward,
the bayline and fluvial profile shifting seaward, and
the coastal plain expanding landward as a result of
onlap. Progradation is shown by the conventional
rising zig-zag facies contact in the deposited sediments. Landward of the equilibrium point is a zone
of relative sea-level fall (this is what the equilibrium
point means, as explained in the definition of this
term by Posamentier et al. 1988, p. 116). These diagrams are not consistent with some of the text in the
two companion papers in this volume, which discuss
the tendency for fluvial incision during latehighstand, relative to sea-level fall. Figures 8 and 15
of Posamentier and Vail (1988) clearly indicate significant late-highstand fluvial deposition, coastal
progradation, and coastal onlap during a time of
relative sea-level fall (as do several figures in Jervey
1988), yet Posamentier and james (1993, p. 15) and
Weimer and Posamentier (1993, p. 10) do not accept
that this is what had been described in the earlier
studies. Careful examination of their Fig. 8 indicates
that the late-highstand fluvial aggradation and
coastal onlap indicated in this diagram have been
created in two ways. First, deposition has been al�
lowed beneath the '
continental margin undergoes rotational subsidence. Second, most of the accommodation has been
created by rotational subsidence at a rate comparable to the eustatic fall in sea level. The equilibrium
profile is not ·shifted' ho.rizo;ntally, but is extended
obliquely downward in a seaward direction.
In retrospect, it is difficult to ascertain the basis
for these models, such as that reproduced in
Fig. 11.1!. Many of the architectural ideas of
Posamentier et al. (1988) are based on the computer
simulations ofJervey (1988), which have led to schematic models of continental-margin configuration
that are difficult to interpret because they lack scales,
and therefore cannot show realistic slopes. Rates of
subsidence and sea-level change are shown as having
the same magnitude, which is commonly not the
case. The late-highstand fluvial on!ap model seems
to have developed from an attempt by Vail and his
co-workers to reinterpret their "sawtooth" coastal-