

336
Fluvial Depositional Systems and Autogenic Sedimentary Controls
fJ
ft f: i
ft IJI'I
i'l
ft fHI fl fi I'HI fJ
100km
1 :
I
J
I
I
• •
F
•
'\o
•
. !II
•
• ·.· •
. 1.. •.
Ill :
•
•
•
•
• •
•
•
·- .
l;m 11 Gat
·fli' II .
..
..
.
•
•
•
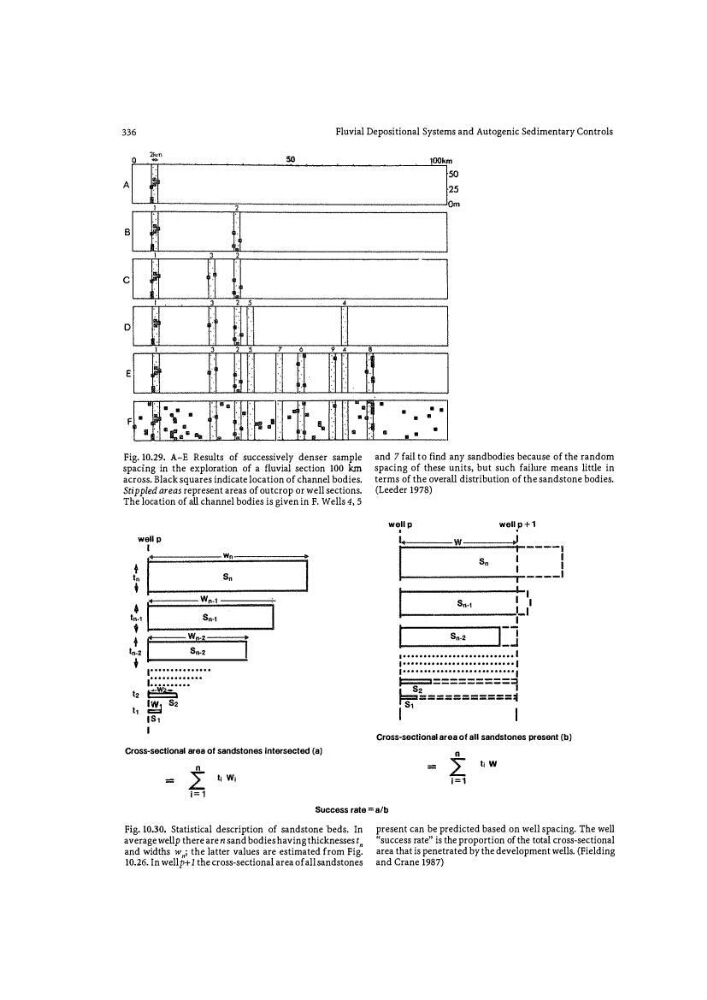
Fig. 10.29. A-E Results of successively denser sample
spacing in the exploration of a fluvial section 100 km
across. Black squares indicate location of channel bodies.
Stippled areas represent areas of outcrop or well sections.
The location of all channel bodies is given in F. Wells 4, 5
well p
I
I
+
t ,
+
I
Wn-t
•
tn-1
Sn-t
f
+
r
Wn-2
tn-2
Sn-2
t
, .............. .
. ::::::::::···
,,
�
,, � s,
)51
I
w,
s,
Cross-sectional area of sandstones intersected (a)
n
=
L tl WI
i=1
and 7 fail to find any sandbodies because of the random
spacing of these units, but such failure means little in
terms of the overall distribution of the sandstone bodies.
(Leeder 1978)
well p
well p+1
•
::1 ===.!! W C=::: s
:::
,
=� ---��
L
.
. .
Sn-1
---- �:-•
I
s, _,
[ J
•••••••••••••••••••••••••••• 1
I••••• ••• •• ••• • •••• • •• • ••• • •
I
I••• • • •• • ••••• •••• • • •• • ••••• I
J::: :=;= ---------:::�
F.F�=:::;:. ::::;:. J
I
s ,
I
Cross-sectional area of all sandstones present (b)
=
±
,, w
i=1
Success rate = a/b
Fig. 10.30. Statistical description of sandstone 'beds. In
average well p there are n sand bodies having thicknesses t ,
and 'Widths w n; the latter values are estimated from Fig.
10.26. In wellp+ 1 the cross-sectional area of all sandstones
present can be predicted based on well spacing. The well
"success rate" is the proportion of the total cross-sectional
area that is penetrated by the development wells. (Fielding
and Crane 1987)
Fluvial Depositional Systems and Autogenic Sedimentary Controls
fJ
ft f: i
ft IJI'I
i'l
ft fHI fl fi I'HI fJ
100km
1 :
I
J
I
I
• •
F
•
'\o
•
. !II
•
• ·.· •
. 1.. •.
Ill :
•
•
•
•
• •
•
•
·- .
l;m 11 Gat
·fli' II .
..
..
.
•
•
•
Fig. 10.29. A-E Results of successively denser sample
spacing in the exploration of a fluvial section 100 km
across. Black squares indicate location of channel bodies.
Stippled areas represent areas of outcrop or well sections.
The location of all channel bodies is given in F. Wells 4, 5
well p
I
I
+
t ,
+
I
Wn-t
•
tn-1
Sn-t
f
+
r
Wn-2
tn-2
Sn-2
t
, .............. .
. ::::::::::···
,,
�
,, � s,
)51
I
w,
s,
Cross-sectional area of sandstones intersected (a)
n
=
L tl WI
i=1
and 7 fail to find any sandbodies because of the random
spacing of these units, but such failure means little in
terms of the overall distribution of the sandstone bodies.
(Leeder 1978)
well p
well p+1
•
::1 ===.!! W C=::: s
:::
,
=� ---��
L
.
. .
Sn-1
---- �:-•
I
s, _,
[ J
•••••••••••••••••••••••••••• 1
I••••• ••• •• ••• • •••• • •• • ••• • •
I
I••• • • •• • ••••• •••• • • •• • ••••• I
J::: :=;= ---------:::�
F.F�=:::;:. ::::;:. J
I
s ,
I
Cross-sectional area of all sandstones present (b)
=
±
,, w
i=1
Success rate = a/b
Fig. 10.30. Statistical description of sandstone 'beds. In
average well p there are n sand bodies having thicknesses t ,
and 'Widths w n; the latter values are estimated from Fig.
10.26. In wellp+ 1 the cross-sectional area of all sandstones
present can be predicted based on well spacing. The well
"success rate" is the proportion of the total cross-sectional
area that is penetrated by the development wells. (Fielding
and Crane 1987)