

Quantitative Studies of Alluvial Architecture
w 50
•
'i5 40
0
"'
"0
c
30
•
w
•
20
"'
•
c
c 10
•
�
0
"0
� 5
•
c
c
4
0
e 3
•
. �
15 2
�
"'
E
0
c
1
0.0
0.2
0.4
0.6
0.8
1.0
sands fraction _..p. .
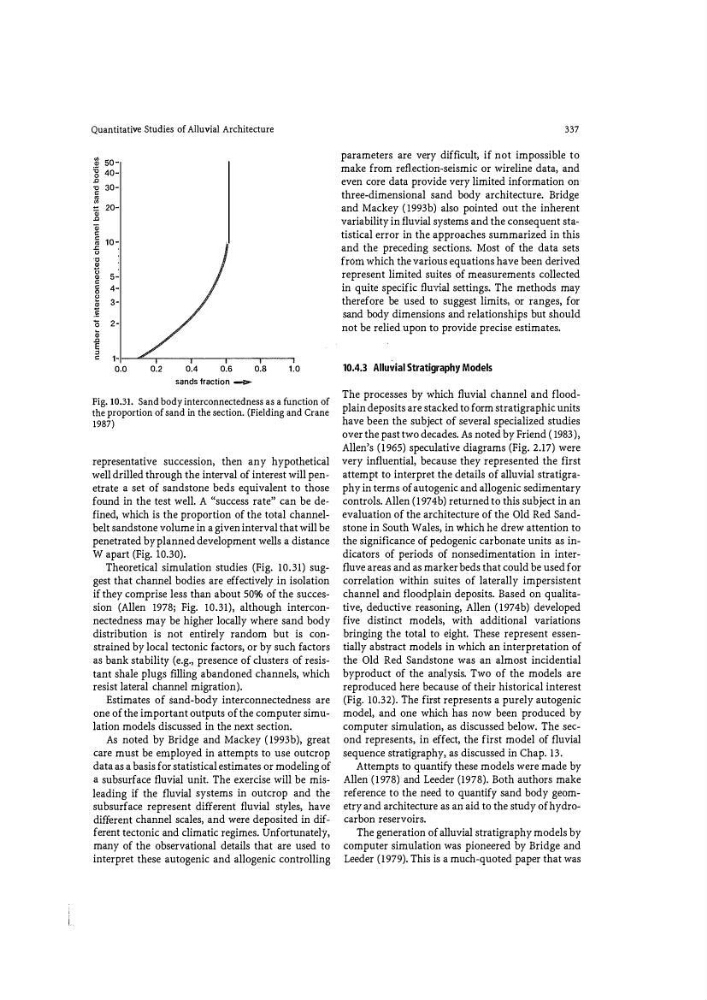
Fig. l0.31. Sand body interconnectedness as a function of
the proportion of sand in the section. (Fielding and Crane
1987)
representative succession, then any hypothetical
well drilled through the interval of interest will penetrate a set of sandstone beds equivalent to those
found in the test well. A "success rate" can be defined, which is the proportion of the total channelbelt sandstone volume in a given interval that will be
penetrated by planned development wells a distance
W apart (Fig. 10.30).
Theoretical simulation studies (Fig. 10.31) suggest that channel bodies are effectively in isolation
if they comprise less than about 50% of the succession (Allen !978; Fig. !0.31), although interconnectedness may be higher locally where sand body
distribution is not entirely random but is constrained by local tectonic factors, or by such factors
as bank stability (e.g., presence of clusters of resistant shale plugs filling abandoned channels, which
resist lateral channel migration).
Estimates of Sand-body interconnectedness are
one of the important outputs of the computer simulation models discussed in the next section.
As noted by Bridge and Mackey (1993b), great
care must be employed in attempts to use outcrop
data as a basis for statistical estimates or modeling of
a subsurface fluvial unit. The exercise will be misleading if the fluvial systems in outcrop and the
subsurface represent different fluvial styles, have
different channel scales, and were deposited in different tectonic and climatic regimes. Unfortunately,
many of the observational details that are used to
interpret these autogenic and allogenic controlling
337
parameters are very difficult, if not impossible to
make from reflection�seismic or wireline data, and
even core data provide very limited information on
three-dimensional sand body architecture. Bridge
and Mackey (!993b) also pointed out the inherent
variability in fluvial systems and the consequent staw
tistical error in the approaches summarized in this
and the preceding sections. Most of the data sets
from which the various equations have been derived
represent limited suites of measurements collected
in quite specific fl uvial settings. The methods may
therefore be used to suggest limits) or ranges, for
sand body dimensions and relationships but should
not be relied upon to provide precise estimates.
10.4.3 Alluvial Stratigraphy Models
The processes by which fl uvial channel and floodplain deposits are stacked to form stratigraphic units
have been the subject of several specialized studies
over the past two decades. As noted by Friend ( !983 ),
Allen's (1965) speculative diagrams (Fig. 2.17) were
very influential, because they represented the flrst
attempt to interpret the details of alluvial stratigra�
phy in terms of autogenic and allogenic sedimentary
controls. Allen (1974b) returned to this subject in an
evaluation of the architecture of the Old Red Sandstone in South Wales, in which he drew attention to
the significance of pedogenic carbonate units as indicators of periods of nonsedimentation in interfluve areas and as marker beds that could be used for
correlation within suites of laterally impersistent
channel and floodplain deposits. Based on qualitative, deductive reasoning, Allen (1974b) developed
five distinct models, with additional variations
bringing the total to eight. These represent essentially abstract models in which an interpretation of
the Old Red Sandstone was an almost incidential
byproduct of the analysis. Two of the models are
reproduced here because of their historical interest
(Fig. 10.32). The first represents a purely autogenic
model, and one which has now been produced by
computer simulation, as discussed below. The second represents, in effect, the first model of fluvial
sequence stratigraphy, as discussed in Chap. 13.
Attempts to quantify these models were made by
Allen (1978) and Leeder (1978). Both authors make
reference to the need to quantify sand body geometry and architecture as an aid to the study of hydrocarbon reservoirs.
The generation of alluvial stratigraphy models by
computer simulation was pioneered by Bridge and
Leeder (1979). This is a much-quoted paper that was
w 50
•
'i5 40
0
"'
"0
c
30
•
w
•
20
"'
•
c
c 10
•
�
0
"0
� 5
•
c
c
4
0
e 3
•
. �
15 2
�
"'
E
0
c
1
0.0
0.2
0.4
0.6
0.8
1.0
sands fraction _..p. .
Fig. l0.31. Sand body interconnectedness as a function of
the proportion of sand in the section. (Fielding and Crane
1987)
representative succession, then any hypothetical
well drilled through the interval of interest will penetrate a set of sandstone beds equivalent to those
found in the test well. A "success rate" can be defined, which is the proportion of the total channelbelt sandstone volume in a given interval that will be
penetrated by planned development wells a distance
W apart (Fig. 10.30).
Theoretical simulation studies (Fig. 10.31) suggest that channel bodies are effectively in isolation
if they comprise less than about 50% of the succession (Allen !978; Fig. !0.31), although interconnectedness may be higher locally where sand body
distribution is not entirely random but is constrained by local tectonic factors, or by such factors
as bank stability (e.g., presence of clusters of resistant shale plugs filling abandoned channels, which
resist lateral channel migration).
Estimates of Sand-body interconnectedness are
one of the important outputs of the computer simulation models discussed in the next section.
As noted by Bridge and Mackey (1993b), great
care must be employed in attempts to use outcrop
data as a basis for statistical estimates or modeling of
a subsurface fluvial unit. The exercise will be misleading if the fluvial systems in outcrop and the
subsurface represent different fluvial styles, have
different channel scales, and were deposited in different tectonic and climatic regimes. Unfortunately,
many of the observational details that are used to
interpret these autogenic and allogenic controlling
337
parameters are very difficult, if not impossible to
make from reflection�seismic or wireline data, and
even core data provide very limited information on
three-dimensional sand body architecture. Bridge
and Mackey (!993b) also pointed out the inherent
variability in fluvial systems and the consequent staw
tistical error in the approaches summarized in this
and the preceding sections. Most of the data sets
from which the various equations have been derived
represent limited suites of measurements collected
in quite specific fl uvial settings. The methods may
therefore be used to suggest limits) or ranges, for
sand body dimensions and relationships but should
not be relied upon to provide precise estimates.
10.4.3 Alluvial Stratigraphy Models
The processes by which fl uvial channel and floodplain deposits are stacked to form stratigraphic units
have been the subject of several specialized studies
over the past two decades. As noted by Friend ( !983 ),
Allen's (1965) speculative diagrams (Fig. 2.17) were
very influential, because they represented the flrst
attempt to interpret the details of alluvial stratigra�
phy in terms of autogenic and allogenic sedimentary
controls. Allen (1974b) returned to this subject in an
evaluation of the architecture of the Old Red Sandstone in South Wales, in which he drew attention to
the significance of pedogenic carbonate units as indicators of periods of nonsedimentation in interfluve areas and as marker beds that could be used for
correlation within suites of laterally impersistent
channel and floodplain deposits. Based on qualitative, deductive reasoning, Allen (1974b) developed
five distinct models, with additional variations
bringing the total to eight. These represent essentially abstract models in which an interpretation of
the Old Red Sandstone was an almost incidential
byproduct of the analysis. Two of the models are
reproduced here because of their historical interest
(Fig. 10.32). The first represents a purely autogenic
model, and one which has now been produced by
computer simulation, as discussed below. The second represents, in effect, the first model of fluvial
sequence stratigraphy, as discussed in Chap. 13.
Attempts to quantify these models were made by
Allen (1978) and Leeder (1978). Both authors make
reference to the need to quantify sand body geometry and architecture as an aid to the study of hydrocarbon reservoirs.
The generation of alluvial stratigraphy models by
computer simulation was pioneered by Bridge and
Leeder (1979). This is a much-quoted paper that was